MetLife 2003 Annual Report Download - page 9
Download and view the complete annual report
Please find page 9 of the 2003 MetLife annual report below. You can navigate through the pages in the report by either clicking on the pages listed below, or by using the keyword search tool below to find specific information within the annual report.-
 1
1 -
 2
2 -
 3
3 -
 4
4 -
 5
5 -
 6
6 -
 7
7 -
 8
8 -
 9
9 -
 10
10 -
 11
11 -
 12
12 -
 13
13 -
 14
14 -
 15
15 -
 16
16 -
 17
17 -
 18
18 -
 19
19 -
 20
20 -
21
-
22
-
23
-
24
-
25
-
26
-
27
-
28
-
29
-
30
-
31
-
32
-
33
-
34
-
35
-
36
-
37
-
38
-
39
-
40
-
41
-
42
-
43
-
44
-
45
-
46
-
47
-
48
-
49
-
50
-
51
-
52
-
53
-
54
-
55
-
56
-
57
-
58
-
59
-
60
-
61
-
62
-
63
-
64
-
65
-
66
-
67
-
68
-
69
-
70
-
71
-
72
-
73
-
74
-
75
-
76
-
77
-
78
-
79
-
80
-
81
-
82
-
83
-
84
-
85
-
86
-
87
-
88
-
89
-
90
-
91
-
92
-
93
-
94
-
95
-
96
-
97
 |
 |
Employee Benefit Plans
The Company sponsors pension and other retirement plans in various forms covering employees who meet specified eligibility requirements. The
reported expense and liability associated with these plans requires an extensive use of assumptions which include the discount rate, expected return on
plan assets and rate of future compensation increases as determined by the Company. Management determines these assumptions based upon
currently available market and industry data, historical performance of the plan and its assets, and consultation with an independent consulting actuarial
firm to aid it in selecting appropriate assumptions and valuing its related liabilities. The actuarial assumptions used in the calculation of the Company’s
aggregate projected benefit obligation may vary and include an expectation of long-term market appreciation in equity markets which is not changed by
minor short-term market fluctuations, but does change when large interim deviations occur. These assumptions used by the Company may differ
materially from actual results due to changing market and economic conditions, higher or lower withdrawal rates or longer or shorter life spans of the
participants. These differences may have a significant effect on the Company’s consolidated financial statements and liquidity.
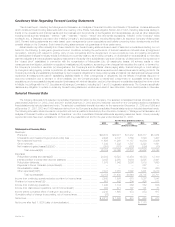
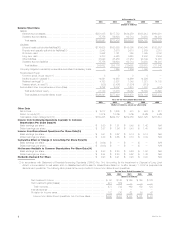
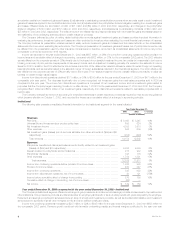
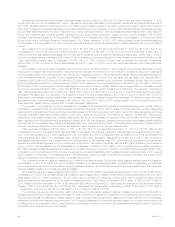
Results of Operations
Year ended December 31, 2003 compared with the year ended December 31, 2002 — The Company
Executive Summary
MetLife, Inc., through its affiliates and subsidiaries, is a leading provider of insurance and other financial services to a broad spectrum of individual
and institutional customers. The Company offers life insurance, annuities, automobile and homeowners insurance and mutual funds to individuals, as well
as group insurance, reinsurance, and retirement and savings products and services to corporations and other institutions. The MetLife companies serve
approximately 13 million households in the U.S. and provide benefits to approximately 37 million employees and family members through their plan
sponsors including 88 of the FORTUNE 100 largest companies. MetLife, Inc. also has direct international insurance operations in 10 countries serving
approximately 8 million customers. MetLife is organized into six business segments: Institutional, Individual, Auto & Home, International, Reinsurance and
Asset Management.
The marketplace for financial services is extremely competitive. MetLife, the largest life insurer in the United States, reported $2.2 billion in net
income and diluted earnings per share of $2.94 for the year ended December 31, 2003. In 2003, after a three-year economic slowdown, there were
improvements in both the credit and equity markets. At the same time, interest rates remained at historic lows and the S&P 500 Index was up 26% for the
year. Total premiums and fees increased to $23.2 billion, up 9% over the prior year, which primarily stems from continued sales growth across most of
the Company’s segments, as well as the positive impact of the U.S. financial markets on policy fees. Assets under management grew to $350.2 billion,
up 17% over the prior year, and Individual annuity deposits grew to $11.2 billion, up 42% over the prior year. MetLife generated over $11 billion of net
investment income while adhering to rigorous asset-liability management principles and portfolio diversification. An increase in expenses year over year is
primarily attributable to employee-related expenses, including pension and postretirement benefit expense and severance, expenses associated with
strengthening the Company’s distribution systems and taking action in consolidating office space and reducing redundancies, while continuing to invest
heavily in infrastructure. In addition, regulatory capital increased and the Company repurchased stock through its buyback program.
Industry Trends
The Company’s segments continue to be influenced by a variety of industry trends and it is the Company’s belief that each of its businesses is well
positioned to capitalize on those trends.
In general, the Company is seeing more employers, both large and small, outsourcing their benefits functions. Further, companies are offering
broader new arrays of voluntary benefits to help retain employees while adding little to their overall benefits costs. These trends will likely continue and in
fact expand across companies of all sizes. Employers are also demanding substantial online access for their employees for various self-service functions.
This functionality requires substantial information technology investment that smaller companies will find difficult to absorb. This will put pressure on those
smaller and mid-size companies to gain scale quickly or exit the business.
In addition, alternative benefit structures, such as simple fixed benefit products, are becoming more popular as the traditional medical indemnity
products costs have continued to increase rapidly. These low cost fixed benefit products can provide effective catastrophic protection for high cost
illnesses to supplement the basic health coverage provided by medical indemnity insurance.
From a demographics standpoint, the bulk of the U.S. population is moving from an asset accumulation phase to an asset distribution phase.
People within ten years of retirement hold significant assets. With continually lengthening lifespans and unstructured asset distribution, the Company
believes many of these people may outlive their retirement savings and/or require long-term care. As a result, the Company expects that the demand for
retirement payout solutions with guarantees will increase dramatically over the next decade.
The combination of these trends will favor those with scale, breadth of distribution and product, ability to provide advice and financial strength to
support the long-term guarantees.
MetLife, Inc.
6