MetLife 2003 Annual Report Download - page 15
Download and view the complete annual report
Please find page 15 of the 2003 MetLife annual report below. You can navigate through the pages in the report by either clicking on the pages listed below, or by using the keyword search tool below to find specific information within the annual report.-
 1
1 -
2
-
3
-
4
-
 5
5 -
 6
6 -
 7
7 -
 8
8 -
 9
9 -
 10
10 -
 11
11 -
 12
12 -
 13
13 -
 14
14 -
 15
15 -
 16
16 -
 17
17 -
 18
18 -
 19
19 -
 20
20 -
 21
21 -
 22
22 -
 23
23 -
 24
24 -
 25
25 -
26
-
27
-
28
-
29
-
30
-
31
-
32
-
33
-
34
-
35
-
36
-
37
-
38
-
39
-
40
-
41
-
42
-
43
-
44
-
45
-
46
-
47
-
48
-
49
-
50
-
51
-
52
-
53
-
54
-
55
-
56
-
57
-
58
-
59
-
60
-
61
-
62
-
63
-
64
-
65
-
66
-
67
-
68
-
69
-
70
-
71
-
72
-
73
-
74
-
75
-
76
-
77
-
78
-
79
-
80
-
81
-
82
-
83
-
84
-
85
-
86
-
87
-
88
-
89
-
90
-
91
-
92
-
93
-
94
-
95
-
96
-
97
 |
 |

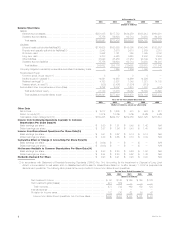
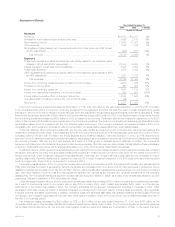
Reinsurance
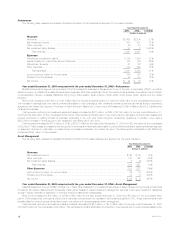
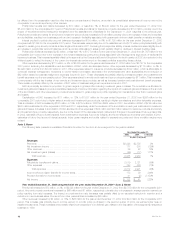
The following table presents consolidated financial information for the Reinsurance segment for the years indicated:
Year Ended December 31,
2003 2002 % Change
(Dollars in millions)
Revenues
Premiums ************************************************************************ $2,668 $2,005 33 %
Net investment income ************************************************************* 473 421 12 %
Other revenues ******************************************************************** 49 43 14 %
Net investment gains (losses) ******************************************************** 31 2 1,450 %
Total revenues***************************************************************** 3,221 2,471 30 %
Expenses
Policyholder benefits and claims****************************************************** 2,136 1,554 37 %
Interest credited to policyholder account balances*************************************** 184 146 26 %
Policyholder dividends ************************************************************** 21 22 (5)%
Other expenses ******************************************************************* 740 622 19 %
Total expenses **************************************************************** 3,081 2,344 31 %
Income before provision for income taxes ********************************************** 140 127 10 %
Provision for income taxes*********************************************************** 48 43 12 %
Net income *********************************************************************** $ 92 $ 84 10 %
Year ended December 31, 2003 compared with the year ended December 31, 2002—Reinsurance
MetLife’s Reinsurance segment is comprised of the life reinsurance business of Reinsurance Group of America, Incorporated (‘‘RGA’’), a publicly
traded company, and MetLife’s ancillary life reinsurance business. RGA has operations in North America and has subsidiary companies, branch offices,
or representative offices in Australia, Barbados, Hong Kong, India, Ireland, Japan, Mexico, South Africa, South Korea, Spain, Taiwan and the United
Kingdom.
Net income increased by $8 million, or 10%, to $92 million for the year ended December 31, 2003 from $84 million for the comparable 2002 period.
The increase in earnings year over year is primarily attributable to new business growth, additional renewal premiums, as well as a large coinsurance
agreement with Allianz Life Insurance Company of North America (‘‘Allianz Life’’) under which RGA assumed 100% of Allianz Life’s U.S. traditional life
reinsurance business.
Total revenues, excluding net investment gains and losses, increased by $721 million, or 29%, to $3,190 million for the year ended December 31,
2003 from $2,469 million for the comparable 2002 period. This increase is primarily due to new premiums from facultative and automatic treaties and
renewal premiums on existing blocks of business, particularly in the U.S. and United Kingdom reinsurance operations. In addition, there was a
$252 million increase in revenues due to the transaction with Allianz Life in late 2003.
Total expenses increased by $737 million, or 31%, to $3,081 million for the year ended December 31, 2003 from $2,344 million for the comparable
2002 period. This increase is consistent with the growth in revenues and is primarily attributable to policyholder benefits and claims and allowances paid
on assumed reinsurance, particularly on certain higher commission business in the United Kingdom. The aforementioned transaction with Allianz Life
contributed $242 million to this increase.
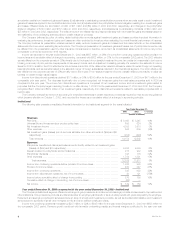
Asset Management
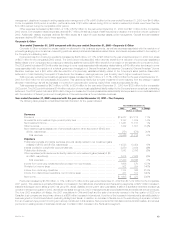
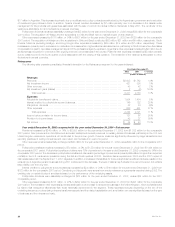
The following table presents consolidated financial information for the Asset Management segment for the years indicated:
Year Ended December 31,
2003 2002 % Change
(Dollars in millions)
Revenues
Net investment income****************************************************************** $ 66 $ 59 12 %
Other revenues ************************************************************************ 143 166 (14)%
Net investment gains (losses) ************************************************************ 9 (4) 325 %
Total revenues ********************************************************************* 218 221 (1)%
Other Expenses ********************************************************************** 182 211 (14)%
Income before provision for income taxes ************************************************** 36 10 260 %
Provision for income taxes *************************************************************** 14 4 250 %
Net income *************************************************************************** $ 22 $ 6 267 %
Year ended December 31, 2003 compared with the year ended December 31, 2002—Asset Management
Asset Management, through SSRM Holdings, Inc. (‘‘State Street Research’’), provides a broad variety of asset management products and services
to MetLife, third-party institutions and individuals. State Street Research offers investment management services in all major investment disciplines
through multiple channels of distribution in both the retail and institutional marketplaces.
Net income increased by $16 million, or 267%, to $22 million for the year ended December 31, 2003 from $6 million for the comparable 2002
period. The increase year over year is mainly due to expense reductions and an increase in net investment gains in 2003. These improvements were
partially offset by lower revenues earned as a result of a reduction in average assets under management.
Total revenues, excluding net investment gains and losses, decreased by $16 million, or 7%, to $209 million for the year ended December 31, 2003
from $225 million for the comparable 2002 period. This decrease is primarily attributable to a decline in revenues earned on lower average assets under
MetLife, Inc.
12