MetLife 2003 Annual Report Download - page 12
Download and view the complete annual report
Please find page 12 of the 2003 MetLife annual report below. You can navigate through the pages in the report by either clicking on the pages listed below, or by using the keyword search tool below to find specific information within the annual report.-
 1
1 -
 2
2 -
 3
3 -
 4
4 -
 5
5 -
 6
6 -
 7
7 -
 8
8 -
 9
9 -
 10
10 -
 11
11 -
 12
12 -
 13
13 -
 14
14 -
 15
15 -
 16
16 -
 17
17 -
 18
18 -
 19
19 -
 20
20 -
 21
21 -
 22
22 -
23
-
24
-
25
-
26
-
27
-
28
-
29
-
30
-
31
-
32
-
33
-
34
-
35
-
36
-
37
-
38
-
39
-
40
-
41
-
42
-
43
-
44
-
45
-
46
-
47
-
48
-
49
-
50
-
51
-
52
-
53
-
54
-
55
-
56
-
57
-
58
-
59
-
60
-
61
-
62
-
63
-
64
-
65
-
66
-
67
-
68
-
69
-
70
-
71
-
72
-
73
-
74
-
75
-
76
-
77
-
78
-
79
-
80
-
81
-
82
-
83
-
84
-
85
-
86
-
87
-
88
-
89
-
90
-
91
-
92
-
93
-
94
-
95
-
96
-
97
 |
 |

increase. Lower net investment losses in 2003 versus 2002 contributed $185 million after-tax to the year over year increase. Favorable underwriting
experience was partially offset by an increase in expenses associated with office closures and other consolidations, as well as an increase in pension and
postretirement benefit costs. In addition, the prior year period includes a $20 million after-tax benefit from the release of a previously established liability for
the Company’s 2001 business realignment initiatives and a $17 million after-tax benefit from the release of a previously established liability for disability
insurance-related losses from the September 11, 2001 tragedies.
Total revenues, excluding net investment gains and losses, increased by $962 million, or 7%, to $14,358 million for the year ended December 31,
2003 from $13,396 million for the comparable 2002 period. The increase is attributable to both the group insurance and the retirement and savings
product lines. Within group insurance, life insurance premiums and fees increased by $238 million, or 5%, which is in line with management’s
expectations. This increase is attributable primarily to higher sales and favorable persistency. The late 2003 acquisition of the John Hancock block of
group life business contributed $72 million to this increase. In addition, the long-term care, dental, and disability products experienced continued growth
at a combined rate of approximately 14%, which is in line with management’s expectations. Retirement and savings revenues increased approximately
12% primarily due to higher sales in the structured settlement products partially offset by the impact of a sale of a significant, single premium contract in
the second quarter of 2002. Premiums and fees from retirement and saving products are significantly influenced by large transactions and, as a result,
can fluctuate from period to period. These increases were partially offset by a decrease in revenues primarily due to a decline in retirement and savings
administrative fees from the Company’s 401(k) business. This decline resulted from the exit from the large market 401(k) business in late 2001.
Consequently, revenue decreased as business was transferred to other carriers throughout 2002.
Total expenses increased by $912 million, or 8%, to $12,829 million for the year ended December 31, 2003 from $11,917 million for the
comparable 2002 period. Policyholder-related expenses increased $659 million primarily as a function of the growth in business. The increase in
expenses is offset by favorable underwriting results in the term life insurance, dental, long-term care, and retirement and savings products. The term life
mortality incurred loss ratio, which represents actual life claims as a percentage of assumed claims incurred used in the determination of future policy
benefits, was 92% for 2003 as compared to 93.6% in 2002. Underwriting results declined in disability as the morbidity incurred loss ratio, which
represents actual disability claims as a percentage of assumed claims incurred used in the determination of future policy benefits, increased to 98.5% in
2003 from 97.9% in the prior year. The 2003 ratio was within management’s expected range. In addition, the 2002 period includes a $28 million release
of a previously established liability for disability insurance-related losses from the September 11, 2001 tragedies. Other expenses increased by
$253 million over the prior year period. Group insurance and retirement and savings expenses increased $115 million primarily due to an increase in non-
deferrable expenses associated with the aforementioned revenue growth, $77 million from an increase in pension and postretirement benefit expense,
and a $33 million increase in expenses associated with office closures and other consolidations. In addition, the prior year period includes a $30 million
release of a previously established liability for the Company’s 2001 business realignment initiatives.
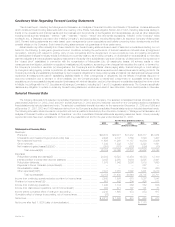
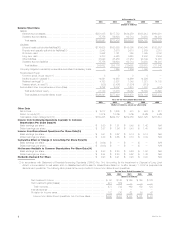
Individual
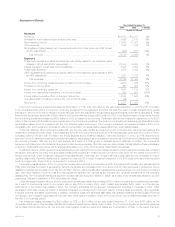
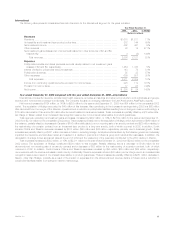
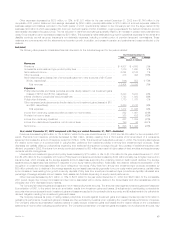
The following table presents consolidated financial information for the Individual segment for the years indicated:
Year Ended December 31,
2003 2002 % Change
(Dollars in millions)
Revenues
Premiums *********************************************************************** $ 4,344 $ 4,507 (4)%
Universal life and investment-type product policy fees ********************************** 1,589 1,379 15%
Net investment income ************************************************************ 6,201 6,244 (1)%
Other revenues******************************************************************* 407 418 (3)%
Net investment gains (losses) (net of amounts allocable from other accounts of ($177) and
($147), respectively)************************************************************* (130) (144) (10)%
Total revenues ***************************************************************** 12,411 12,404 0%
Expenses
Policyholder benefits and claims (excludes amounts directly related to net investment gains
(losses) of ($144) and ($157), respectively) ***************************************** 5,183 5,220 (1)%
Interest credited to policyholder account balances ************************************* 1,793 1,793 0%
Policyholder dividends ************************************************************* 1,700 1,770 (4)%
Other expenses (excludes amounts directly related to net investment gains (losses) of ($33)
and $10, respectively) *********************************************************** 2,880 2,629 10%
Total expenses ***************************************************************** 11,556 11,412 1%
Income from continuing operations before provision for income taxes********************** 855 992 (14)%
Provision for income taxes ********************************************************* 284 365 (22)%
Income from continuing operations ************************************************** 571 627 (9)%
Income from discontinued operations, net of income taxes ****************************** 30 199 (85)%
Net income ********************************************************************** $ 601 $ 826 (27)%
Year ended December 31, 2003 compared with the year ended December 31, 2002—Individual
MetLife’s Individual segment offers a wide variety of protection and asset accumulation products aimed at serving the financial needs of its
customers throughout their entire life cycle. Products offered by Individual include insurance products, such as traditional, universal and variable life
insurance and variable and fixed annuities. In addition, Individual sales representatives distribute disability insurance and long-term care insurance
products offered through the Institutional segment, investment products, such as mutual funds, as well as other products offered by the Company’s other
businesses.
Income from continuing operations decreased by $56 million, or 9%, to $571 million for the year ended December 31, 2003 from $627 million for
the comparable 2002 period. The decrease year over year is primarily driven by an increase in expenses of $144 million, or 1%, which is largely
attributable to an increase in expenses associated with office closures and other consolidations, pension and postretirement benefit costs, an increase in
MetLife, Inc. 9