MetLife 2003 Annual Report Download - page 20
Download and view the complete annual report
Please find page 20 of the 2003 MetLife annual report below. You can navigate through the pages in the report by either clicking on the pages listed below, or by using the keyword search tool below to find specific information within the annual report.-
 1
1 -
2
-
3
-
4
-
5
-
6
-
7
-
8
-
9
-
 10
10 -
 11
11 -
 12
12 -
 13
13 -
 14
14 -
 15
15 -
 16
16 -
 17
17 -
 18
18 -
 19
19 -
 20
20 -
 21
21 -
 22
22 -
 23
23 -
 24
24 -
 25
25 -
 26
26 -
 27
27 -
 28
28 -
 29
29 -
 30
30 -
31
-
32
-
33
-
34
-
35
-
36
-
37
-
38
-
39
-
40
-
41
-
42
-
43
-
44
-
45
-
46
-
47
-
48
-
49
-
50
-
51
-
52
-
53
-
54
-
55
-
56
-
57
-
58
-
59
-
60
-
61
-
62
-
63
-
64
-
65
-
66
-
67
-
68
-
69
-
70
-
71
-
72
-
73
-
74
-
75
-
76
-
77
-
78
-
79
-
80
-
81
-
82
-
83
-
84
-
85
-
86
-
87
-
88
-
89
-
90
-
91
-
92
-
93
-
94
-
95
-
96
-
97
 |
 |

Other expenses decreased by $215 million, or 12%, to $1,531 million for the year ended December 31, 2002 from $1,746 million in the
comparable 2001 period. Retirement and savings decreased by $293 million, primarily attributable to $184 million of accrued expenses related to
business realignment initiatives recorded in the fourth quarter of 2001 (predominantly related to the Company’s exit from the large market 401(k)
business), $30 million of which was released into income in the fourth quarter of 2002. In addition, ongoing expenses for the defined contribution product
have steadily decreased throughout 2002. The net reduction in retirement and savings is partially offset by an increase in pension and postretirement
costs. Group insurance other expenses increased by $78 million. This increase is mainly attributable to growth in operational expenses for the dental and
disability products, as well as group insurance’s non-deferrable expenses, including a certain portion of premium taxes and commissions. These
variances are commensurate with the aforementioned premium growth. In addition, an increase in pension and postretirement costs contributed to the
variance.
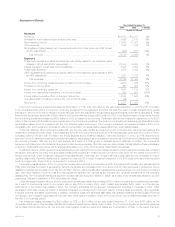
Individual
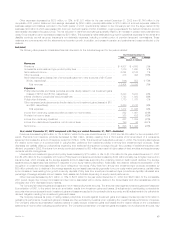
The following table presents consolidated financial information for the Individual segment for the years indicated:
Year Ended December 31,
2002 2001 % Change
(Dollars in millions)
Revenues
Premiums ********************************************************************** $ 4,507 $ 4,563 (1)%
Universal life and investment-type product policy fees ********************************* 1,379 1,260 9 %
Net investment income *********************************************************** 6,244 6,165 1 %
Other revenues****************************************************************** 418 495 (16)%
Net investment gains (losses) (net of amounts allocable from other accounts of ($147) and
($134), respectively)************************************************************ (144) 853 (117)%
Total revenues ************************************************************** 12,404 13,336 (7)%
Expenses
Policyholder benefits and claims (excludes amounts directly related to net investment gains
(losses) of ($157) and ($159), respectively) **************************************** 5,220 5,233 (0)%
Interest credited to policyholder account balances ************************************ 1,793 1,898 (6)%
Policyholder dividends ************************************************************ 1,770 1,767 0 %
Other expenses (excludes amounts directly related to net investment gains (losses) of $10
and $25, respectively) ********************************************************** 2,629 2,747 (4)%
Total expenses ************************************************************** 11,412 11,645 (2)%
Income from continuing operations before provision for income taxes********************* 992 1,691 (41)%
Provision for income taxes ******************************************************** 365 632 (42)%
Income from continuing operations ************************************************* 627 1,059 (41)%
Income from discontinued operations, net of income taxes ***************************** 199 36 453 %
Net income ********************************************************************* $ 826 $ 1,095 (25)%
Year ended December 31, 2002 compared with the year ended December 31, 2001—Individual
Premiums decreased by $56 million, or 1%, to $4,507 million for the year ended December 31, 2002 from $4,563 million for the comparable 2001
period. Premiums from insurance products decreased by $94 million, primarily resulting from a third quarter 2002 amendment of a reinsurance
agreement to increase the amount of insurance ceded from 50% to 100%. This amendment was effective January 1, 2002. The Company also believes
the decline is the result of a continued shift in policyholders’ preference from traditional policies to annuity and investment-type products. These
decreases are partially offset by policyholders expanding their traditional life insurance coverage through the purchase of additional insurance with
dividend proceeds in 2002. Premiums from annuity products increased by $38 million as a result of higher sales of fixed annuities and supplementary
contracts with life contingencies.
Universal life and investment-type product policy fees increased by $119 million, or 9%, to $1,379 million for the year ended December 31, 2002
from $1,260 million for the comparable 2001 period. Policy fees from insurance products increased by $144 million primarily due to higher revenue from
insurance fees, which increase as the average separate account asset base supporting the underlying minimum death benefit declines. The average
separate account asset base has declined in response to poor equity market performance. Additionally, this variance reflects the acceleration of the
recognition of unearned fees associated with future reinsurance recoveries. Policy fees from annuity and investment-type products decreased by
$25 million primarily due to declines in the average separate account asset base resulting generally from poor equity market performance, partially offset
by an increase in fees resulting from growth in annuity deposits. Policy fees from annuity and investment-type products are typically calculated as a
percentage of average separate account assets. Such assets can fluctuate depending on equity market performance.
Other revenues decreased by $77 million, or 16%, to $418 million for the year ended December 31, 2002 from $495 million for the comparable
2001 period, largely due to lower commission and fee income associated with a volume decline in the broker/dealer and other subsidiaries which is
principally due to the depressed equity markets.
The Company’s investment gains and losses are net of related policyholder amounts. The amounts netted against investment gains and losses are
(i) amortization of DAC, to the extent that such amortization results from investment gains and losses, (ii) adjustments to participating contractholder
accounts when amounts equal to such investment gains and losses are applied to the contractholder’s accounts, and (iii) adjustments to the policyholder
dividend obligation resulting from investment gains and losses.
The Company believes its policy of netting related policyholder amounts against investment gains and losses provides important information in
evaluating its performance. Investment gains and losses are often excluded by investors when evaluating the overall financial performance of insurers.
The Company believes its presentation enables readers to easily exclude investment gains and losses and the related effects on the consolidated
statements of income when evaluating its performance. The Company’s presentation of investment gains and losses, net of policyholder amounts, may
MetLife, Inc. 17