MetLife 2003 Annual Report Download - page 24
Download and view the complete annual report
Please find page 24 of the 2003 MetLife annual report below. You can navigate through the pages in the report by either clicking on the pages listed below, or by using the keyword search tool below to find specific information within the annual report.-
 1
1 -
2
-
3
-
4
-
5
-
6
-
7
-
8
-
9
-
10
-
11
-
12
-
13
-
 14
14 -
 15
15 -
 16
16 -
 17
17 -
 18
18 -
 19
19 -
 20
20 -
 21
21 -
 22
22 -
 23
23 -
 24
24 -
 25
25 -
 26
26 -
 27
27 -
 28
28 -
 29
29 -
 30
30 -
 31
31 -
 32
32 -
 33
33 -
 34
34 -
35
-
36
-
37
-
38
-
39
-
40
-
41
-
42
-
43
-
44
-
45
-
46
-
47
-
48
-
49
-
50
-
51
-
52
-
53
-
54
-
55
-
56
-
57
-
58
-
59
-
60
-
61
-
62
-
63
-
64
-
65
-
66
-
67
-
68
-
69
-
70
-
71
-
72
-
73
-
74
-
75
-
76
-
77
-
78
-
79
-
80
-
81
-
82
-
83
-
84
-
85
-
86
-
87
-
88
-
89
-
90
-
91
-
92
-
93
-
94
-
95
-
96
-
97
 |
 |

Asset Management
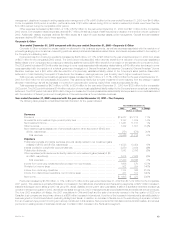
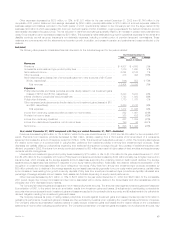
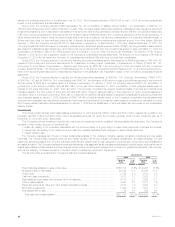
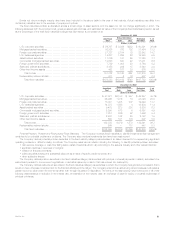
The following table presents consolidated financial information for the Asset Management segment for the years indicated:
Year Ended December 31,
2002 2001 % Change
(Dollars in millions)
Revenues
Net investment income****************************************************************** $ 59 $ 71 (17)%
Other revenues ************************************************************************ 166 198 (16)%
Net investment gains (losses) ************************************************************ (4) 25 (116)%
Total revenues ********************************************************************* 221 294 (25)%
Other Expenses ********************************************************************** 211 252 (16)%
Income before provision for income taxes ************************************************** 10 42 (76)%
Provision for income taxes *************************************************************** 4 15 (73)%
Net income *************************************************************************** $ 6 $ 27 (78)%
Year ended December 31, 2002 compared with the year ended December 31, 2001—Asset Management
Other revenues, which primarily consist of management and advisory fees from third parties, decreased by $32 million, or 16%, to $166 million for
the year ended December 31, 2002 from $198 million for the comparable 2001 period. The most significant factor contributing to this decline is a
$31 million decrease resulting from the sale of Conning, which occurred in July 2001. Excluding the impact of this transaction, other revenues remained
essentially unchanged at $166 million for the year ended December 31, 2002 as compared to $167 million for the year ended December 31, 2001.
Despite lower average assets under management, revenues remained constant due to performance and incentive fees earned on certain real estate and
hedge fund products. The lower assets under management are primarily due to institutional client withdrawals, and the downturn in the equity market. In
addition, fourth quarter 2002 product closings and business exits also contributed to this decline.
Other expenses decreased by $41 million, or 16%, to $211 million for the year ended December 31, 2002 from $252 million for the comparable
2001 period. Excluding the impact of the sale of Conning, other expenses decreased by $6 million, or 3%, to $211 million in 2002 from $217 million in
2001. This decrease is due to reductions in marketing-related expenses and expenses related to fund reimbursements. In addition, a decrease in
amortization of deferred sales commissions resulted from a reduction in sales. These decreases were partially offset by a $5 million increase in employee
compensation attributable to severance-related expenses resulting from third and fourth quarter 2002 staff reductions.
Corporate & Other
Year ended December 31, 2002 compared with the year ended December 31, 2001—Corporate & Other
Other revenues decreased by $29 million, or 34%, to $56 million for the year ended December 31, 2002 from $85 million for the comparable 2001
period. This is primarily attributable to the remeasurement of the Company’s reinsurance recoverable associated with the sales practices reinsurance
treaty in 2001, as well as an increase in the elimination of intersegment activity. This is partially offset from a gain on the sale of a company-occupied
building, and income earned on COLI purchased during 2002.
Other expenses increased by $65 million, or 10%, to $722 million for the year ended December 31, 2002 from $657 million for the comparable
2001 period, primarily due to increases in legal and interest expenses. The 2002 period includes a $266 million charge to increase the Company’s
asbestos-related liability, expenses to cover costs associated with the resolution of federal government investigations of General American’s former
Medicare business and a reduction of a previously established liability related to the Company’s sales practices class action settlement. The 2001 period
includes a $250 million charge recorded in the fourth quarter of 2001 to cover costs associated with the resolution of class action lawsuits and a
regulatory inquiry pending against Metropolitan Life, involving alleged race-conscious insurance underwriting practices prior to 1973. The increase in
interest expenses is primarily due to increases in long-term debt resulting from the issuance of $1.25 billion and $1 billion of senior debt in November
2001 and December 2002, respectively, partially offset by a decrease in commercial paper in 2002. In addition, a decrease in the elimination of
intersegment activity contributed to the variance.
Business Realignment Initiatives
During the fourth quarter of 2001, the Company implemented several business realignment initiatives, which resulted from a strategic review of
operations and an ongoing commitment to reduce expenses. The impact of these actions on a segment basis were charges of $399 million in
Institutional, $97 million in Individual and $3 million in Auto & Home. The liability at December 31, 2003 and 2002 was $27 million and $40 million, in the
Institutional segment and $9 million and $18 million, in the Individual segment, respectively. The remaining liability is due to certain contractual obligations.
September 11, 2001 Tragedies
On September 11, 2001, terrorist attacks occurred in New York, Washington, D.C. and Pennsylvania (the ‘‘tragedies’’) triggering a significant loss of
life and property, which had an adverse impact on certain of the Company’s businesses. The Company’s original estimate of the total insurance losses
related to the tragedies, which was recorded in the third quarter of 2001, was $208 million, net of income taxes of $117 million. As of December 31,
2003 and 2002, the Company’s remaining liability for unpaid and future claims associated with the tragedies was $9 million and $47 million, respectively,
principally related to disability coverages. This estimate has been and will continue to be subject to revision in subsequent periods, as claims are received
from insureds and processed. Any revision to the estimate of losses in subsequent periods will affect net income in such periods.
MetLife Capital Trust I
In connection with MetLife, Inc.’s, initial public offering in April 2000, the Holding Company and MetLife Capital Trust I (the ‘‘Trust’’) issued equity
security units (the ‘‘units’’). Each unit originally consisted of (i) a contract to purchase, for $50, shares of the Holding Company’s common stock (the
‘‘purchase contracts’’) on May 15, 2003; and (ii) a capital security of the Trust, with a stated liquidation amount of $50.
In accordance with the terms of the units, the Trust was dissolved on February 5, 2003, and $1,006 million aggregate principal amount of 8.00%
debentures of the Holding Company (the ‘‘MetLife debentures’’), the sole assets of the Trust, were distributed to the owners of the Trust’s capital
securities in exchange for their capital securities. The MetLife debentures were remarketed on behalf of the debenture owners on February 12, 2003 and
the interest rate on the MetLife debentures was reset as of February 15, 2003 to 3.911% per annum for a yield to maturity of 2.876%. As a result of the
MetLife, Inc. 21