MetLife 2003 Annual Report Download - page 51
Download and view the complete annual report
Please find page 51 of the 2003 MetLife annual report below. You can navigate through the pages in the report by either clicking on the pages listed below, or by using the keyword search tool below to find specific information within the annual report.-
 1
1 -
2
-
3
-
4
-
5
-
6
-
7
-
8
-
9
-
10
-
11
-
12
-
13
-
14
-
15
-
16
-
17
-
18
-
19
-
20
-
21
-
22
-
23
-
24
-
25
-
26
-
27
-
28
-
29
-
30
-
31
-
32
-
33
-
34
-
35
-
36
-
37
-
38
-
39
-
40
-
 41
41 -
 42
42 -
 43
43 -
 44
44 -
 45
45 -
 46
46 -
 47
47 -
 48
48 -
 49
49 -
 50
50 -
 51
51 -
 52
52 -
 53
53 -
 54
54 -
 55
55 -
 56
56 -
 57
57 -
 58
58 -
 59
59 -
 60
60 -
 61
61 -
62
-
63
-
64
-
65
-
66
-
67
-
68
-
69
-
70
-
71
-
72
-
73
-
74
-
75
-
76
-
77
-
78
-
79
-
80
-
81
-
82
-
83
-
84
-
85
-
86
-
87
-
88
-
89
-
90
-
91
-
92
-
93
-
94
-
95
-
96
-
97
 |
 |

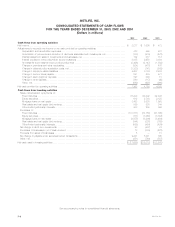
METLIFE, INC.
CONSOLIDATED STATEMENTS OF CASH FLOWS
FOR THE YEARS ENDED DECEMBER 31, 2003, 2002 AND 2001
(Dollars in millions)
2003 2002 2001
Cash flows from operating activities
Net income************************************************************************************ $ 2,217 $ 1,605 $ 473
Adjustments to reconcile net income to net cash provided by operating activities:
Depreciation and amortization expenses******************************************************** 478 498 481
Amortization of premiums and accretion of discounts associated with investments, net***************** (180) (519) (575)
(Gains) losses from sales of investments and businesses, net ************************************* 152 317 713
Interest credited to other policyholder account balances ****************************************** 3,035 2,950 3,084
Universal life and investment-type product policy fees ******************************************** (2,496) (2,147) (1,889)
Change in premiums and other receivables ***************************************************** (334) (473) 476
Change in deferred policy acquisition costs, net ************************************************* (1,332) (741) (563)
Change in insurance-related liabilities ********************************************************** 4,687 3,104 2,508
Change in income taxes payable ************************************************************* 241 479 477
Change in bank customer deposits *********************************************************** 897 209 81
Change in other liabilities ******************************************************************** 560 (117) (40)
Other, net ********************************************************************************* (562) (997) (968)
Net cash provided by operating activities *********************************************************** 7,363 4,168 4,258
Cash flows from investing activities
Sales, maturities and repayments of:
Fixed maturities **************************************************************************** 76,200 64,602 52,426
Equity securities**************************************************************************** 612 2,703 2,125
Mortgage loans on real estate **************************************************************** 3,483 2,638 1,993
Real estate and real estate joint ventures ******************************************************* 889 835 344
Other limited partnership interests ************************************************************* 308 209 396
Purchases of:
Fixed maturities **************************************************************************** (101,577) (85,155) (51,865)
Equity securities**************************************************************************** (187) (1,260) (3,354)
Mortgage loans on real estate **************************************************************** (4,975) (3,206) (3,494)
Real estate and real estate joint ventures ******************************************************* (344) (208) (769)
Other limited partnership interests ************************************************************* (588) (456) (424)
Net change in short-term investments *********************************************************** 98 (477) 74
Purchases of businesses, net of cash received *************************************************** 18 (879) (276)
Proceeds from sales of businesses ************************************************************* 5—81
Net change in payable under securities loaned transactions ***************************************** 9,221 5,201 360
Other, net *********************************************************************************** (851) (760) (587)
Net cash used in investing activities *************************************************************** $ (17,688) $(16,213) $ (2,970)
See accompanying notes to consolidated financial statements.
MetLife, Inc.
F-6