MetLife 2003 Annual Report Download - page 40
Download and view the complete annual report
Please find page 40 of the 2003 MetLife annual report below. You can navigate through the pages in the report by either clicking on the pages listed below, or by using the keyword search tool below to find specific information within the annual report.-
 1
1 -
2
-
3
-
4
-
5
-
6
-
7
-
8
-
9
-
10
-
11
-
12
-
13
-
14
-
15
-
16
-
17
-
18
-
19
-
20
-
21
-
22
-
23
-
24
-
25
-
26
-
27
-
28
-
29
-
 30
30 -
 31
31 -
 32
32 -
 33
33 -
 34
34 -
 35
35 -
 36
36 -
 37
37 -
 38
38 -
 39
39 -
 40
40 -
 41
41 -
 42
42 -
 43
43 -
 44
44 -
 45
45 -
 46
46 -
 47
47 -
 48
48 -
 49
49 -
 50
50 -
51
-
52
-
53
-
54
-
55
-
56
-
57
-
58
-
59
-
60
-
61
-
62
-
63
-
64
-
65
-
66
-
67
-
68
-
69
-
70
-
71
-
72
-
73
-
74
-
75
-
76
-
77
-
78
-
79
-
80
-
81
-
82
-
83
-
84
-
85
-
86
-
87
-
88
-
89
-
90
-
91
-
92
-
93
-
94
-
95
-
96
-
97
 |
 |

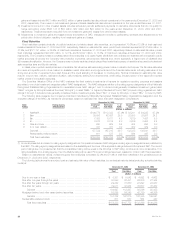
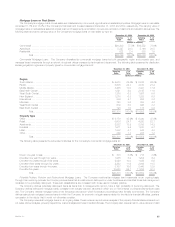
The following table presents the changes in valuation allowances for agricultural mortgage loans for the:
Years Ended December 31,
2003 2002 2001
(Dollars in millions)
Balance, beginning of year ********************************************************************** $6 $9 $ 7
Additions ************************************************************************************* 1321
Deductions *********************************************************************************** (1) (6) (19)
Balance, end of year *************************************************************************** $6 $6 $ 9
The principal risks in holding agricultural mortgage loans are property specific, supply and demand, financial and capital market risks. Property
specific risks include the geographic location of the property, soil types, weather conditions and the other factors that may impact the borrower’s
guaranty. Supply and demand risks include the supply and demand for the commodities produced on the specific property and the related price for
those commodities. Financial risks include the overall level of debt on the property and the amount of principal repaid during the loan term. Capital market
risks include the general level of interest rates, the liquidity for these securities in the marketplace and the capital available for loan refinancing.
Real Estate and Real Estate Joint Ventures
The Company’s real estate and real estate joint venture investments consist of commercial, residential and agricultural properties located primarily
throughout the U.S. The Company manages these investments through a network of regional offices overseen by its investment department. At
December 31, 2003 and 2002, the carrying value of the Company’s real estate, real estate joint ventures and real estate held-for-sale was $4,803 million
and $4,725 million, respectively, or 2.2%, and 2.5% of total cash and invested assets, respectively. The carrying value of real estate is stated at
depreciated cost net of impairments and valuation allowances. The carrying value of real estate joint ventures is stated at the Company’s equity in the real
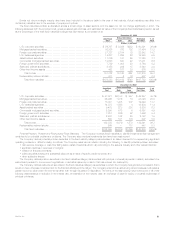
estate joint ventures net of impairments and valuation allowances. The following table presents the carrying value of the Company’s real estate, real estate
joint ventures, real estate held-for-sale and real estate acquired upon foreclosure at:
December 31, 2003 December 31, 2002
Carrying % of Carrying % of
Type Value Total Value Total
(Dollars in millions)
Real estate held-for-investment ******************************************************* $4,274 89.0% $3,546 75.0%
Real estate joint ventures held-for-investment ******************************************* 438 9.1 377 8.0
Foreclosed real estate held-for-investment ********************************************** 2 0.1 3 0.1
4,714 98.2 3,926 83.1
Real estate held-for-sale ************************************************************* 88 1.8 792 16.8
Foreclosed real estate held-for-sale**************************************************** 1 0.0 7 0.1
89 1.8 799 16.9
Total real estate, real estate joint ventures and real estate held-for-sale ********************** $4,803 100.0% $4,725 100.0%
Office properties represent 58% of the Company’s equity real estate portfolio at both December 31, 2003 and 2002. The average occupancy level
of office properties was 89% and 92% at December 31, 2003 and 2002, respectively.
Ongoing management of these investments includes quarterly valuations, as well as an annual market update and review of each property’s budget,
financial returns, lease rollover status and the Company’s exit strategy.
The Company adjusts the carrying value of real estate and real estate joint ventures held-for-investment for impairments whenever events or
changes in circumstances indicate that the carrying value of the property may not be recoverable. The Company writes down impaired real estate to
estimated fair value, when the carrying value of the real estate exceeds the sum of the undiscounted cash flow expected to result from the use and
eventual disposition of the real estate. The Company records writedowns as investment losses and reduces the cost basis of the properties accordingly.
The Company does not change the revised cost basis for subsequent recoveries in value.
The Company’s real estate equity portfolio at December 31, 2003 was mainly comprised of a core portfolio of multi-tenanted office buildings with
high tenant credit quality, net leased properties and apartments. The objective is to maximize earnings by building upon and strengthening the core
portfolio through selective acquisitions and dispositions. The Company took advantage of a significant demand for Class A, institutional grade properties
and sold certain real estate holdings in its portfolio mostly during the fourth quarter of 2002. This sales program did not represent any fundamental
change in the Company’s investment strategy.
Once the Company identifies a property that is expected to be sold within one year and commences a firm plan for marketing the property, in
accordance with SFAS 144, the Company, if applicable, classifies the property as held-for-sale and reports the related net investment income and any
resulting investment gains and losses as discontinued operations. Further, the Company establishes and periodically revises, if necessary, a valuation
allowance to adjust the carrying value of the property to its expected sales value, less associated selling costs, if it is lower than the property’s carrying
value. The Company records valuation allowances as investment losses and subsequent adjustments as investment gains or losses. If circumstances
arise that were previously considered unlikely and, as a result, the property is expected to be on the market longer than anticipated, a held-for-sale
property is generally reclassified to held-for-investment and measured as such.
The Company’s carrying value of real estate held-for-sale, including real estate acquired upon foreclosure of commercial and agricultural mortgage
loans, in the amounts of $89 million and $799 million at December 31, 2003 and 2002, respectively, are net of valuation allowances of $12 million and
$11 million, respectively. There were no impairments at December 31, 2003; however, the December 31, 2002 amount included a net impairment of
$5 million.
The Company records real estate acquired upon foreclosure of commercial and agricultural mortgage loans at the lower of estimated fair value or the
carrying value of the mortgage loan at the date of foreclosure.
Certain of the Company’s investments in real estate joint ventures meet the definition of a VIE under FIN 46(r). See ‘‘— Variable Interest Entities.’’
On August 28, 2003, the Company (through one of its subsidiaries) acquired the Sears Tower building through the acquisition of a controlling
interest in a partnership holding title to the building. Subsequent to December 31, 2003, MetLife entered into a marketing agreement to sell one of its real
MetLife, Inc. 37