MetLife 2003 Annual Report Download - page 11
Download and view the complete annual report
Please find page 11 of the 2003 MetLife annual report below. You can navigate through the pages in the report by either clicking on the pages listed below, or by using the keyword search tool below to find specific information within the annual report.-
 1
1 -
 2
2 -
 3
3 -
 4
4 -
 5
5 -
 6
6 -
 7
7 -
 8
8 -
 9
9 -
 10
10 -
 11
11 -
 12
12 -
 13
13 -
 14
14 -
 15
15 -
 16
16 -
 17
17 -
 18
18 -
 19
19 -
 20
20 -
 21
21 -
 22
22 -
23
-
24
-
25
-
26
-
27
-
28
-
29
-
30
-
31
-
32
-
33
-
34
-
35
-
36
-
37
-
38
-
39
-
40
-
41
-
42
-
43
-
44
-
45
-
46
-
47
-
48
-
49
-
50
-
51
-
52
-
53
-
54
-
55
-
56
-
57
-
58
-
59
-
60
-
61
-
62
-
63
-
64
-
65
-
66
-
67
-
68
-
69
-
70
-
71
-
72
-
73
-
74
-
75
-
76
-
77
-
78
-
79
-
80
-
81
-
82
-
83
-
84
-
85
-
86
-
87
-
88
-
89
-
90
-
91
-
92
-
93
-
94
-
95
-
96
-
97
 |
 |

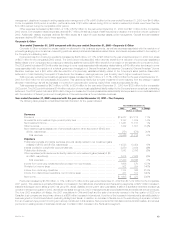
amortization results from investment gains and losses, (ii) adjustments to participating contractholder accounts when amounts equal to such investment
gains and losses are applied to the contractholder’s accounts, and (iii) adjustments to the policyholder dividend obligation resulting from investment gains
and losses. Offsets include the amortization of DAC of $31 million and ($5) million in 2003 and 2002, respectively, and changes in the policyholder
dividend obligation of $144 million and $157 million in 2003 and 2002, respectively, and adjustments to participating contracts of $40 million and
($7) million in 2003 and 2002, respectively. The dollar amount of the offsets may vary disproportionately with net investment gains and losses based on
the relationship of the underlying sold securities to certain insurance products.
The Company believes its policy of netting related policyholder amounts against investment gains and losses provides important information in
evaluating its performance. Investment gains and losses are often excluded by investors when evaluating the overall financial performance of insurers.
The Company believes its presentation enables readers to easily exclude investment gains and losses and the related effects on the consolidated
statements of income when evaluating its performance. The Company’s presentation of investment gains and losses, net of policyholder amounts, may
be different from the presentation used by other insurance companies and, therefore, amounts in its consolidated statements of income may not be
comparable to amounts reported by other insurers.
Income tax expense for the year ended December 31, 2003 was $687 million, or 26% of income from continuing operations before provision for
income taxes and cumulative effect of change in accounting, compared with $502 million, or 31%, for the comparable 2002 period. The 2003 effective
tax rate differs from the corporate tax rate of 35% primarily due to the impact of non-taxable investment income, tax credits for investments in low income
housing, a recovery of prior year tax overpayments on tax-exempt bonds, and an adjustment consisting primarily of a revision in the estimate of income
taxes for 2002. In addition, the 2003 effective tax rate includes a reduction of the deferred tax valuation allowance related to certain foreign net operating
loss carryforwards, and tax benefits related to the sale and merger of foreign subsidiaries reflected in the International segment. The 2002 effective tax
rate differs from the corporate tax rate of 35% primarily due to the impact of non-taxable investment income, partially offset by the inability to utilize tax
benefits on certain foreign capital losses.
Income from discontinued operations declined $171 million, or 36%, to $300 million for the year ended December 31, 2003 from $471 million in the
comparable prior year period. The decrease is primarily due to lower recognized net investment gains from real estate properties sold in 2003 as
compared to the prior year. The income from discontinued operations is comprised of net investment income and net investment gains related to
properties that the Company began marketing for sale on or after January 1, 2002. For the years ended December 31, 2003 and 2002, the Company
recognized $421 million and $582 million of net investment gains, respectively, from discontinued operations related to real estate properties sold or
held-for-sale.
The Company changed its method of accounting for embedded derivatives in certain insurance products as required by new accounting guidance
which became effective on October 1, 2003, and recorded the impact as a cumulative effect of a change in accounting principle.
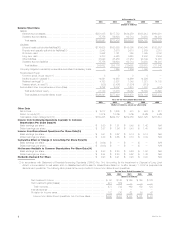
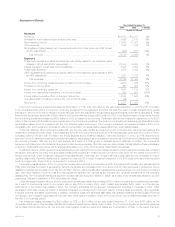
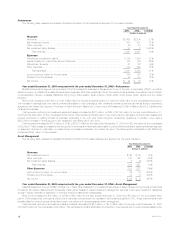
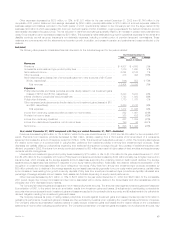
Institutional
The following table presents consolidated financial information for the Institutional segment for the years indicated:
Year Ended December 31,
2003 2002 % Change
(Dollars in millions)
Revenues
Premiums *********************************************************************** $ 9,093 $ 8,245 10%
Universal life and investment-type product policy fees ********************************** 635 624 2%
Net investment income ************************************************************ 4,038 3,918 3%
Other revenues******************************************************************* 592 609 (3)%
Net investment gains (losses) (net of amounts allocable from other accounts of ($89) and $6,
respectively) ******************************************************************* (204) (494) 59%
Total revenues ***************************************************************** 14,154 12,902 10%
Expenses
Policyholder benefits and claims (excludes amounts directly related to net investment gains
(losses) of ($89) and $6, respectively)********************************************** 9,932 9,339 6%
Interest credited to policyholder account balances ************************************* 915 932 (2)%
Policyholder dividends ************************************************************* 198 115 72%
Other expenses ****************************************************************** 1,784 1,531 17%
Total expenses *************************************************************** 12,829 11,917 8%
Income from continuing operations before provision for income taxes********************** 1,325 985 35%
Provision for income taxes ********************************************************* 480 347 38%
Income from continuing operations ************************************************** 845 638 32%
Income from discontinued operations, net of income taxes ****************************** 30 121 (75)%
Income before cumulative effect of change in accounting ******************************* 875 759 15%
Cumulative effect of change in accounting, net of income taxes ************************** (26) —
Net income ********************************************************************** $ 849 $ 759 12%
Year ended December 31, 2003 compared with the year ended December 31, 2002—Institutional
The Company’s Institutional segment offers a broad range of group insurance and retirement and savings products and services to corporations and
other institutions. Group insurance products are offered as either an employer-paid benefit, or as a voluntary benefit with premiums paid by the employee.
Retirement and savings products and services include an array of annuity and investment products, as well as bundled administrative and investment
services sold to sponsors of small- and mid-sized 401(k) and other defined contribution plans.
Income from continuing operations increased by $207 million, or 32%, to $845 million for the year ended December 31, 2003 from $638 million for
the comparable 2002 period. Revenue growth combined with favorable underwriting results and interest margins contributed to the year over year
MetLife, Inc.
8