Kraft 2010 Annual Report Download - page 99
Download and view the complete annual report
Please find page 99 of the 2010 Kraft annual report below. You can navigate through the pages in the report by either clicking on the pages listed below, or by using the keyword search tool below to find specific information within the annual report.-
 1
1 -
2
-
3
-
4
-
5
-
6
-
7
-
8
-
9
-
10
-
11
-
12
-
13
-
14
-
15
-
16
-
17
-
18
-
19
-
20
-
21
-
22
-
23
-
24
-
25
-
26
-
27
-
28
-
29
-
30
-
31
-
32
-
33
-
34
-
35
-
36
-
37
-
38
-
39
-
40
-
41
-
42
-
43
-
44
-
45
-
46
-
47
-
48
-
49
-
50
-
51
-
52
-
53
-
54
-
55
-
56
-
57
-
58
-
59
-
60
-
61
-
62
-
63
-
64
-
65
-
66
-
67
-
68
-
69
-
70
-
71
-
72
-
73
-
74
-
75
-
76
-
77
-
78
-
79
-
80
-
81
-
82
-
83
-
84
-
85
-
86
-
87
-
88
-
 89
89 -
 90
90 -
 91
91 -
 92
92 -
 93
93 -
 94
94 -
 95
95 -
 96
96 -
 97
97 -
 98
98 -
 99
99 -
 100
100 -
 101
101 -
 102
102 -
 103
103 -
 104
104 -
 105
105 -
 106
106 -
 107
107 -
 108
108 -
 109
109 -
110
-
111
-
112
-
113
-
114
-
115
-
116
-
117
-
118
-
119
-
120
-
121
-
122
-
123
-
124
-
125
-
126
-
127
-
128
-
129
-
130
-
131
-
132
-
133
-
134
-
135
-
136
-
137
-
138
-
139
-
140
-
141
-
142
-
143
-
144
-
145
-
146
-
147
-
148
-
149
-
150
-
151
-
152
-
153
-
154
-
155
-
156
-
157
-
158
-
159
-
160
-
161
-
162
-
163
-
164
-
165
-
166
-
167
-
168
-
169
-
170
-
171
-
172
-
173
-
174
-
175
-
176
-
177
-
178
-
179
-
180
-
181
-
182
-
183
-
184
-
185
-
186
-
187
-
188
-
189
-
190
-
191
-
192
-
193
-
194
-
195
-
196
-
197
-
198
-
199
-
200
-
201
-
202
-
203
-
204
-
205
-
206
-
207
-
208
-
209
-
210
 |
 |

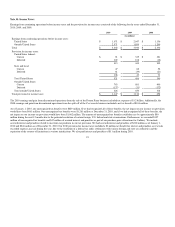
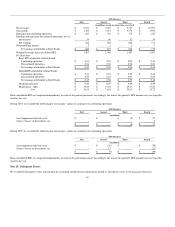
For the Years Ended December 31,
2010 2009 2008
(in millions; 2009 & 2008 revised)
Earnings from continuing
operations before income
taxes:
Operating income:
Kraft Foods North
America:
U.S. Beverages $ 564 $ 511 $ 381
U.S. Cheese 598 667 563
U.S. Convenient
Meals 268 234 125
U.S. Grocery 1,164 1,146 1,009
U.S. Snacks 845 723 638
Canada & N.A.
Foodservice 582 462 395
Kraft Foods Europe 1,115 785 182
Kraft Foods
Developing Markets 1,577 936 815
Unrealized gains /
(losses) on hedging
activities 67 203 (205)
Certain U.S. pension
plan costs (179) (165) -
General corporate
expenses (724) (293) (304)
Amortization of
intangibles (211) (26) (23)
Operating income 5,666 5,183 3,576
Interest and other
expense, net (2,024) (1,237) (1,240)
Earnings from continuing
operations before income
taxes $ 3,642 $ 3,946 $ 2,336
Our largest customer, Wal-Mart Stores, Inc. and its affiliates, accounted for approximately 14% of consolidated net revenues in 2010, 16% in 2009 and 16%
in 2008. These net revenues occurred primarily in the Kraft Foods North America segment.
In 2010, the change in unrealized gains on hedging activities of $67 million primarily resulted from gains associated with commodity hedging activities. In
2009, the change in unrealized gains on hedging activities of $203 million primarily resulted from the 2008 unrealized losses on energy derivatives becoming
realized in 2009 and therefore, included in segment operating income. In 2008, the change in unrealized losses on hedging activities of $205 million primarily
related to energy derivatives, including heating oil (used primarily to hedge transportation costs) and natural gas contracts.
The 2010 increase in general corporate expenses was primarily due to acquisition-related transaction fees, Integration Program costs and the impact of
Cadbury's corporate charges. We incurred acquisition-related transaction fees of $218 million in 2010 and $40 million in 2009. We recorded these charges in
operations as part of general corporate expenses. In 2009, general corporate expenses included $50 million of charges for legal matters related to certain of
our European operations. In 2008, we recorded $72 million in charges for legal matters related to certain of our U.S. and European operations, including U.S.
coffee operations and represented the primary reason general corporate expenses increased $101 million in 2008.
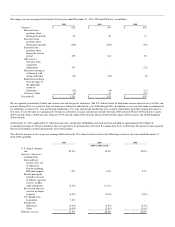
As described in Note 2, Acquisitions and Divestitures, we divested several operations, and recorded net gains / (losses) on these divestitures in segment
operating income as follows:
For the Years Ended December 31,
2010 2009 2008
(in millions)
Kraft Foods North America:
U.S. Beverages $ - $ - $ (1)
U.S. Cheese (6) - -
U.S. Convenient Meals - - -
U.S. Grocery - - -
U.S. Snacks - 11 -
Canada & N.A.
Foodservice - - -
Kraft Foods Europe - (17) (91)
Kraft Foods Developing
Markets - - -