Kraft 2010 Annual Report Download - page 41
Download and view the complete annual report
Please find page 41 of the 2010 Kraft annual report below. You can navigate through the pages in the report by either clicking on the pages listed below, or by using the keyword search tool below to find specific information within the annual report.-
 1
1 -
2
-
3
-
4
-
5
-
6
-
7
-
8
-
9
-
10
-
11
-
12
-
13
-
14
-
15
-
16
-
17
-
18
-
19
-
20
-
21
-
22
-
23
-
24
-
25
-
26
-
27
-
28
-
29
-
30
-
 31
31 -
 32
32 -
 33
33 -
 34
34 -
 35
35 -
 36
36 -
 37
37 -
 38
38 -
 39
39 -
 40
40 -
 41
41 -
 42
42 -
 43
43 -
 44
44 -
 45
45 -
 46
46 -
 47
47 -
 48
48 -
 49
49 -
 50
50 -
 51
51 -
52
-
53
-
54
-
55
-
56
-
57
-
58
-
59
-
60
-
61
-
62
-
63
-
64
-
65
-
66
-
67
-
68
-
69
-
70
-
71
-
72
-
73
-
74
-
75
-
76
-
77
-
78
-
79
-
80
-
81
-
82
-
83
-
84
-
85
-
86
-
87
-
88
-
89
-
90
-
91
-
92
-
93
-
94
-
95
-
96
-
97
-
98
-
99
-
100
-
101
-
102
-
103
-
104
-
105
-
106
-
107
-
108
-
109
-
110
-
111
-
112
-
113
-
114
-
115
-
116
-
117
-
118
-
119
-
120
-
121
-
122
-
123
-
124
-
125
-
126
-
127
-
128
-
129
-
130
-
131
-
132
-
133
-
134
-
135
-
136
-
137
-
138
-
139
-
140
-
141
-
142
-
143
-
144
-
145
-
146
-
147
-
148
-
149
-
150
-
151
-
152
-
153
-
154
-
155
-
156
-
157
-
158
-
159
-
160
-
161
-
162
-
163
-
164
-
165
-
166
-
167
-
168
-
169
-
170
-
171
-
172
-
173
-
174
-
175
-
176
-
177
-
178
-
179
-
180
-
181
-
182
-
183
-
184
-
185
-
186
-
187
-
188
-
189
-
190
-
191
-
192
-
193
-
194
-
195
-
196
-
197
-
198
-
199
-
200
-
201
-
202
-
203
-
204
-
205
-
206
-
207
-
208
-
209
-
210
 |
 |

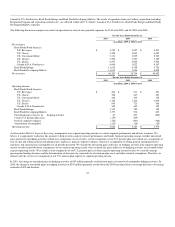
support costs, higher non-recurring costs associated with the Kraft Foods Europe Reorganization, higher other selling, general and administrative expenses
(primarily spending on Cost Savings Initiatives), asset impairment charges related to certain intangible assets in the Netherlands and to write off an investment
in Norway, the net loss on the divestiture of a plant in Spain, unfavorable volume/mix (lower shipments, net of improved product mix) and the impact of
divestitures.
Kraft Foods Europe Reorganization - The reorganization of our European operations to function on a pan-European centralized category management and
value chain model was completed in 2009 for our chocolate, coffee and cheese categories. The integration of our European biscuits business was principally
completed in the second quarter of 2010. Our subsidiary, Kraft Foods Europe GmbH, acts as the European Principal Company ("EPC"). The EPC manages
our European categories centrally and makes decisions for all aspects of the value chain, except for sales and distribution. Our European subsidiaries will
execute sales and distribution locally, and the local production companies act as toll manufacturers on behalf of the EPC. As part of the reorganization, we
incurred $21 million of severance costs and $69 million of other project costs during 2010; $32 million of severance costs and $81 million of other project
costs during 2009; and we incurred $16 million of restructuring costs, $39 million of implementation costs and $11 million of other non-recurring costs during
2008. In 2010 and 2009, these charges were recorded within cost of sales and selling, general and administrative expenses The 2008 restructuring and
implementation costs were included in the total Restructuring Program charges, and the other non-recurring costs were recorded as selling, general and
administrative expenses. Management believes the disclosure of other project costs and other non-recurring costs provides readers of our financial statements
greater transparency to the total costs of our Kraft Foods Europe Reorganization.
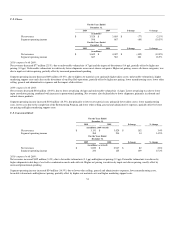
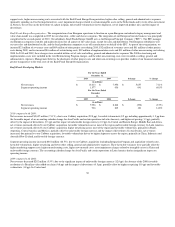
Kraft Foods Developing Markets
For the Years Ended
December 31,
2010 2009 $ change % change
(in millions)
Net revenues $ 13,613 $ 7,956 $ 5,657 71.1%
Segment operating income 1,577 936 641 68.5%
For the Years Ended
December
31,
2009 2008 $ change % change
(in millions)
Net revenues $ 7,956 $ 8,248 $ (292) (3.5%)
Segment operating income 936 815 121 14.8%
2010 compared with 2009:
Net revenues increased $5,657 million (71.1%), due to our Cadbury acquisition (59.8 pp), favorable volume/mix (8.5 pp; including approximately 1.9 pp from
the favorable impact of an accounting calendar change for Asia Pacific and certain operations in Latin America), and higher net pricing (3.3 pp), partially
offset by the impact of divestitures (0.3 pp) and the impact of unfavorable foreign currency (0.2 pp). In Central and Eastern Europe, Middle East and Africa,
net revenues increased, driven by our Cadbury acquisition, favorable volume/mix across most of the region and favorable foreign currency. In Latin America,
net revenues increased, driven by our Cadbury acquisition, higher net pricing across most of the region and favorable volume/mix, primarily in Brazil,
Argentina, Central America and Mexico, partially offset by unfavorable foreign currency and the impact of divestitures. In Asia Pacific, net revenues
increased, due primarily to our Cadbury acquisition, favorable volume/mix driven by higher shipments across the region, primarily in China, Indonesia and
Australia/New Zealand, and favorable foreign currency.
Segment operating income increased $641 million (68.5%), due to our Cadbury acquisition (including Integration Program and acquisition-related costs),
favorable volume/mix, higher net pricing and lower other selling, general and administrative expenses. These favorable variances were partially offset by
higher marketing support costs, higher manufacturing costs, higher raw material costs, asset impairment charges related to intangible assets in China and
unfavorable foreign currency. The accounting calendar change for Asia Pacific and certain operations in Latin America had an insignificant impact on
operating income.
2009 compared with 2008:
Net revenues decreased $292 million (3.5%), due to the significant impact of unfavorable foreign currency (12.9 pp), the absence of the 2008 favorable
resolution of a Brazilian value added tax claim (0.8 pp) and the impact of divestitures (0.5 pp), partially offset by higher net pricing (8.9 pp) and favorable
volume/mix (1.8 pp). In Central and
38