Kraft 2010 Annual Report Download - page 61
Download and view the complete annual report
Please find page 61 of the 2010 Kraft annual report below. You can navigate through the pages in the report by either clicking on the pages listed below, or by using the keyword search tool below to find specific information within the annual report.-
 1
1 -
2
-
3
-
4
-
5
-
6
-
7
-
8
-
9
-
10
-
11
-
12
-
13
-
14
-
15
-
16
-
17
-
18
-
19
-
20
-
21
-
22
-
23
-
24
-
25
-
26
-
27
-
28
-
29
-
30
-
31
-
32
-
33
-
34
-
35
-
36
-
37
-
38
-
39
-
40
-
41
-
42
-
43
-
44
-
45
-
46
-
47
-
48
-
49
-
50
-
 51
51 -
 52
52 -
 53
53 -
 54
54 -
 55
55 -
 56
56 -
 57
57 -
 58
58 -
 59
59 -
 60
60 -
 61
61 -
 62
62 -
 63
63 -
 64
64 -
 65
65 -
 66
66 -
 67
67 -
 68
68 -
 69
69 -
 70
70 -
 71
71 -
72
-
73
-
74
-
75
-
76
-
77
-
78
-
79
-
80
-
81
-
82
-
83
-
84
-
85
-
86
-
87
-
88
-
89
-
90
-
91
-
92
-
93
-
94
-
95
-
96
-
97
-
98
-
99
-
100
-
101
-
102
-
103
-
104
-
105
-
106
-
107
-
108
-
109
-
110
-
111
-
112
-
113
-
114
-
115
-
116
-
117
-
118
-
119
-
120
-
121
-
122
-
123
-
124
-
125
-
126
-
127
-
128
-
129
-
130
-
131
-
132
-
133
-
134
-
135
-
136
-
137
-
138
-
139
-
140
-
141
-
142
-
143
-
144
-
145
-
146
-
147
-
148
-
149
-
150
-
151
-
152
-
153
-
154
-
155
-
156
-
157
-
158
-
159
-
160
-
161
-
162
-
163
-
164
-
165
-
166
-
167
-
168
-
169
-
170
-
171
-
172
-
173
-
174
-
175
-
176
-
177
-
178
-
179
-
180
-
181
-
182
-
183
-
184
-
185
-
186
-
187
-
188
-
189
-
190
-
191
-
192
-
193
-
194
-
195
-
196
-
197
-
198
-
199
-
200
-
201
-
202
-
203
-
204
-
205
-
206
-
207
-
208
-
209
-
210
 |
 |

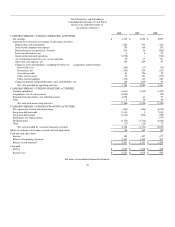
Kraft Foods Inc. and Subsidiaries
Consolidated Statements of Cash Flows
for the years ended December 31,
(in millions of dollars)
2010 2009 2008
CASH PROVIDED BY / (USED IN) OPERATING ACTIVITIES
Net earnings $ 4,139 $ 3,028 $ 2,893
Adjustments to reconcile net earnings to operating cash flows:
Depreciation and amortization 1,440 931 986
Stock-based compensation expense 174 164 178
Deferred income tax provision / (benefit) 251 38 (208)
Losses on divestitures, net 6 6 92
Gains on discontinued operations (1,596) - (926)
Asset impairment and exit costs, net of cash paid 55 17 731
Other non-cash expense, net 329 269 87
Change in assets and liabilities, excluding the effects of acquisitions and divestitures:
Receivables, net (165) (17) (39)
Inventories, net (359) 299 (151)
Accounts payable 83 126 29
Other current assets 42 351 (535)
Other current liabilities (776) 111 985
Change in pension and postretirement assets and liabilities, net 125 (239) 19
Net cash provided by operating activities 3,748 5,084 4,141
CASH PROVIDED BY / (USED IN) INVESTING ACTIVITIES
Capital expenditures (1,661) (1,330) (1,367)
Acquisitions, net of cash received (9,848) - (99)
Proceeds from divestitures, net of disbursements 4,039 41 97
Other 8 50 49
Net cash used in investing activities (7,462) (1,239) (1,320)
CASH PROVIDED BY / (USED IN) FINANCING ACTIVITIES
Net repayments of short-term borrowings (864) (446) (5,912)
Long-term debt proceeds 9,433 3 7,018
Long-term debt repaid (2,134) (968) (795)
Repurchase of Common Stock - - (777)
Dividends paid (2,175) (1,712) (1,663)
Other (72) (10) 72
Net cash provided by / (used in) financing activities 4,188 (3,133) (2,057)
Effect of exchange rate changes on cash and cash equivalents (94) 145 (87)
Cash and cash equivalents:
Increase 380 857 677
Balance at beginning of period 2,101 1,244 567
Balance at end of period $ 2,481 $ 2,101 $ 1,244
Cash paid:
Interest $ 1,593 $ 1,308 $ 968
Income taxes $ 2,232 $ 1,025 $ 964
See notes to consolidated financial statements.
58