Kraft 2010 Annual Report Download - page 30
Download and view the complete annual report
Please find page 30 of the 2010 Kraft annual report below. You can navigate through the pages in the report by either clicking on the pages listed below, or by using the keyword search tool below to find specific information within the annual report.-
 1
1 -
2
-
3
-
4
-
5
-
6
-
7
-
8
-
9
-
10
-
11
-
12
-
13
-
14
-
15
-
16
-
17
-
18
-
19
-
 20
20 -
 21
21 -
 22
22 -
 23
23 -
 24
24 -
 25
25 -
 26
26 -
 27
27 -
 28
28 -
 29
29 -
 30
30 -
 31
31 -
 32
32 -
 33
33 -
 34
34 -
 35
35 -
 36
36 -
 37
37 -
 38
38 -
 39
39 -
 40
40 -
41
-
42
-
43
-
44
-
45
-
46
-
47
-
48
-
49
-
50
-
51
-
52
-
53
-
54
-
55
-
56
-
57
-
58
-
59
-
60
-
61
-
62
-
63
-
64
-
65
-
66
-
67
-
68
-
69
-
70
-
71
-
72
-
73
-
74
-
75
-
76
-
77
-
78
-
79
-
80
-
81
-
82
-
83
-
84
-
85
-
86
-
87
-
88
-
89
-
90
-
91
-
92
-
93
-
94
-
95
-
96
-
97
-
98
-
99
-
100
-
101
-
102
-
103
-
104
-
105
-
106
-
107
-
108
-
109
-
110
-
111
-
112
-
113
-
114
-
115
-
116
-
117
-
118
-
119
-
120
-
121
-
122
-
123
-
124
-
125
-
126
-
127
-
128
-
129
-
130
-
131
-
132
-
133
-
134
-
135
-
136
-
137
-
138
-
139
-
140
-
141
-
142
-
143
-
144
-
145
-
146
-
147
-
148
-
149
-
150
-
151
-
152
-
153
-
154
-
155
-
156
-
157
-
158
-
159
-
160
-
161
-
162
-
163
-
164
-
165
-
166
-
167
-
168
-
169
-
170
-
171
-
172
-
173
-
174
-
175
-
176
-
177
-
178
-
179
-
180
-
181
-
182
-
183
-
184
-
185
-
186
-
187
-
188
-
189
-
190
-
191
-
192
-
193
-
194
-
195
-
196
-
197
-
198
-
199
-
200
-
201
-
202
-
203
-
204
-
205
-
206
-
207
-
208
-
209
-
210
 |
 |

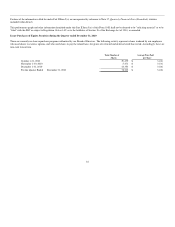
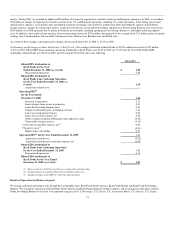
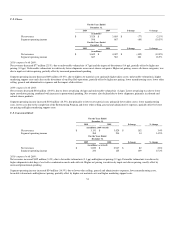
Our 2008 effective tax rate included net tax benefits of $222 million from discrete tax events. Of the total net tax benefits, approximately $50 million related
to fourth quarter corrections of state, federal and foreign tax liabilities and a third quarter reconciliation of our inventory of deferred tax items that resulted in a
write-down of our net deferred tax liabilities. The remaining net tax benefits primarily related to the resolution of various tax audits and the expiration of
statutes of limitations in various jurisdictions. Other discrete tax benefits included the impact from divestitures of a Nordic and Baltic snacks operation and
several operations in Spain and the tax benefit from impairment charges taken in 2008. In addition, the 2008 tax rate benefited from foreign earnings taxed
below the U.S. federal statutory tax rate and from the expected tax benefit of 2008 restructuring expenses. These benefits were only partially offset by state
tax expense and certain foreign tax costs.
Consolidated Results of Operations
The following discussion compares our consolidated results of operations for 2010 with 2009, and for 2009 with 2008.
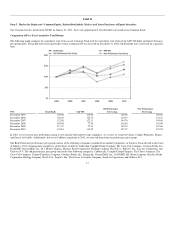
Many factors have an impact on the sales to our customers, including, among others, the timing of holidays and other annual or special events, significant
weather conditions, timing of our own or customer incentive programs and pricing actions, customer inventory programs and general economic conditions.
Our domestic operating subsidiaries report results as of the last Saturday of the year, and our international operating subsidiaries generally report results two
weeks prior to the last Saturday of the year. The results of operations of the newly acquired Cadbury Limited (formerly, Cadbury plc) ("Cadbury") are
reported on the last day of the calendar month. In 2010, we changed the consolidation date for certain European biscuits operations, which are included within
our Kraft Foods Europe segment, and certain operations in Asia Pacific and Latin America, which are included within our Kraft Foods Developing Markets
segment. Previously, these operations primarily reported period-end results one month or two weeks prior to the end of the period. Now our Kraft Foods
Europe segment primarily reports period-end results two weeks prior to the last Saturday of the period, and certain of our operations in Asia Pacific and Latin
America report results through the last day of the period.
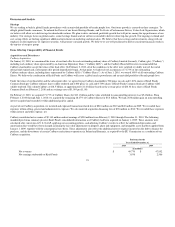
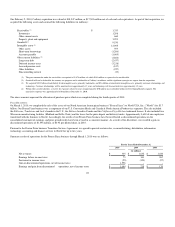
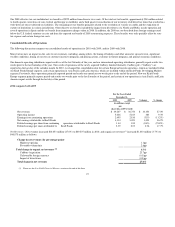
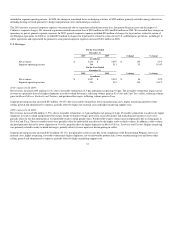
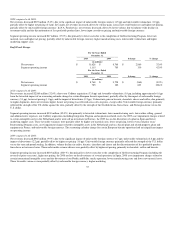
2010 compared with 2009
For the Years Ended
December 31,
2010 2009 $ change % change
(in millions, except
per
share data; 2009 revised)
Net revenues $ 49,207 $ 38,754 $ 10,453 27.0%
Operating income 5,666 5,183 483 9.3%
Earnings from continuing operations 2,495 2,810 (315) (11.2%)
Net earnings attributable to Kraft Foods 4,114 3,021 1,093 36.2%
Diluted earnings per share from continuing operations attributable to Kraft Foods 1.44 1.89 (0.45) (23.8%)
Diluted earnings per share attributable to Kraft Foods 2.39 2.03 0.36 17.7%
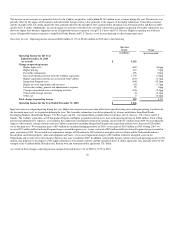
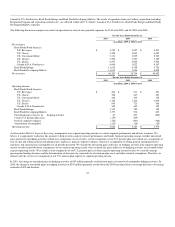
Net Revenues - Net revenues increased $10,453 million (27.0%) to $49,207 million in 2010, and organic net revenues(1) increased $1,430 million (3.7%) to
$40,075 million as follows.
Change in net revenues (by percentage point)
Higher net pricing 1.1pp
Favorable volume/mix 2.6pp
Total change in organic net revenues (1) 3.7%
Cadbury Acquisition 23.7pp
Unfavorable foreign currency (0.1)pp
Impact of divestitures (0.3)pp
Total change in net revenues 27.0%
(1) Please see the Non-GAAP Financial Measures section at the end of this Item.
27