Kraft 2010 Annual Report Download - page 33
Download and view the complete annual report
Please find page 33 of the 2010 Kraft annual report below. You can navigate through the pages in the report by either clicking on the pages listed below, or by using the keyword search tool below to find specific information within the annual report.-
 1
1 -
2
-
3
-
4
-
5
-
6
-
7
-
8
-
9
-
10
-
11
-
12
-
13
-
14
-
15
-
16
-
17
-
18
-
19
-
20
-
21
-
22
-
 23
23 -
 24
24 -
 25
25 -
 26
26 -
 27
27 -
 28
28 -
 29
29 -
 30
30 -
 31
31 -
 32
32 -
 33
33 -
 34
34 -
 35
35 -
 36
36 -
 37
37 -
 38
38 -
 39
39 -
 40
40 -
 41
41 -
 42
42 -
 43
43 -
44
-
45
-
46
-
47
-
48
-
49
-
50
-
51
-
52
-
53
-
54
-
55
-
56
-
57
-
58
-
59
-
60
-
61
-
62
-
63
-
64
-
65
-
66
-
67
-
68
-
69
-
70
-
71
-
72
-
73
-
74
-
75
-
76
-
77
-
78
-
79
-
80
-
81
-
82
-
83
-
84
-
85
-
86
-
87
-
88
-
89
-
90
-
91
-
92
-
93
-
94
-
95
-
96
-
97
-
98
-
99
-
100
-
101
-
102
-
103
-
104
-
105
-
106
-
107
-
108
-
109
-
110
-
111
-
112
-
113
-
114
-
115
-
116
-
117
-
118
-
119
-
120
-
121
-
122
-
123
-
124
-
125
-
126
-
127
-
128
-
129
-
130
-
131
-
132
-
133
-
134
-
135
-
136
-
137
-
138
-
139
-
140
-
141
-
142
-
143
-
144
-
145
-
146
-
147
-
148
-
149
-
150
-
151
-
152
-
153
-
154
-
155
-
156
-
157
-
158
-
159
-
160
-
161
-
162
-
163
-
164
-
165
-
166
-
167
-
168
-
169
-
170
-
171
-
172
-
173
-
174
-
175
-
176
-
177
-
178
-
179
-
180
-
181
-
182
-
183
-
184
-
185
-
186
-
187
-
188
-
189
-
190
-
191
-
192
-
193
-
194
-
195
-
196
-
197
-
198
-
199
-
200
-
201
-
202
-
203
-
204
-
205
-
206
-
207
-
208
-
209
-
210
 |
 |

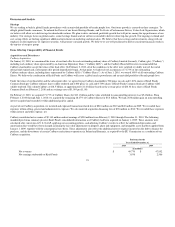
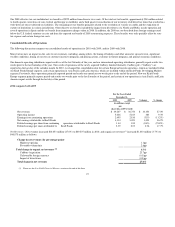
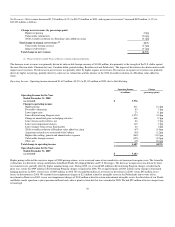
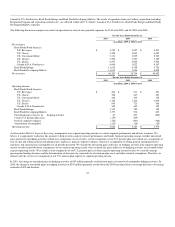
Net Revenues - Net revenues decreased $1,738 million (4.3%) to $38,754 million in 2009, and organic net revenues(1) increased $428 million (1.1%) to
$40,565 million as follows.
Change in net revenues (by percentage point)
Higher net pricing 2.0pp
Unfavorable volume/mix (0.8)pp
2008 favorable resolution of a Brazilian value added tax claim (0.1)pp
Total change in organic net revenues (1) 1.1%
Unfavorable foreign currency (4.7)pp
Impact of divestitures (0.7)pp
Total change in net revenues (4.3)%
(1) Please see the Non-GAAP Financial Measures section at the end of this item.
The decrease in net revenues was primarily driven by unfavorable foreign currency of $1,884 million, due primarily to the strength of the U.S. dollar against
the euro, Russian ruble, Ukrainian hryvnia, Canadian dollar, pound sterling, Brazilian real and Polish zloty. The impact of divestitures also had an unfavorable
impact on net revenues. The decrease in net revenues was partially offset by higher organic net revenues. The increase in organic net revenues was primarily
driven by higher net pricing, partially offset by a decrease in volume/mix and the absence of the 2008 favorable resolution of a Brazilian value added tax
claim.
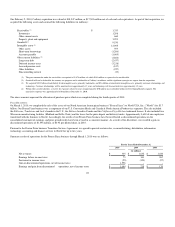
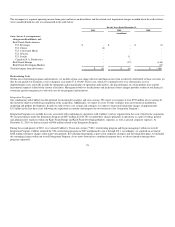
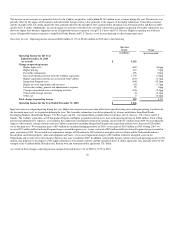
Operating Income - Operating income increased $1,607 million (44.9%) to $5,183 million in 2009, due to the following:
Operating Income Change
(in millions) (percentage point)
Operating Income for the Year
Ended December 31, 2008
(as revised) $ 3,576
Change in operating income
Higher pricing 811 16.5pp
Favorable volume/mix 83 1.7pp
Lower input costs 23 0.1pp
Lower Restructuring Program costs 1,074 34.2pp
Change in unrealized gains on hedging activities 408 8.3pp
Lower losses on divestitures, net 86 3.7pp
Lower asset impairment charges 119 3.3pp
Lower charges from certain legal matters 22 1.6pp
2008 favorable resolution of Brazilian value added tax claim (67) (1.4)pp
Acquisition-related costs associated with Cadbury (40) (1.2)pp
Higher other selling, general and administrative expense (569) (11.9)pp
Unfavorable foreign currency (325) (9.2)pp
Other, net (18) (0.8)pp
Total change in operating income 1,607 44.9%
Operating Income for the Year
Ended December 31, 2009
(as revised) $ 5,183
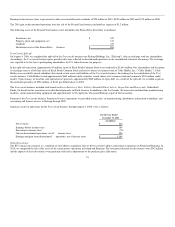
Higher pricing reflected the carryover impact of 2008 pricing actions, as we recovered some of our cumulative cost increases from prior years. The favorable
volume/mix was driven by strong contributions from Kraft Foods Developing Markets and U.S. Beverages. The decrease in input costs was driven by lower
raw material costs, partially offset by higher manufacturing costs. During 2009, we reversed $85 million in Restructuring Program charges recorded in the
prior year, versus the $989 million in Restructuring Program charges recognized in 2008. We recognized gains of $203 million on the change in unrealized
hedging positions in 2009, versus losses of $205 million in 2008. We recorded $6 million of net losses on divestitures in 2009, versus $92 million of net
losses on divestitures in 2008. We recorded asset impairment charges of $21 million related to intangible assets in the Netherlands and to write off an
investment in Norway in 2009, versus asset impairment charges of $140 million related to certain international intangible assets, the divestiture of our Nordic
and Baltic snacks operation, a juice operation in Brazil and a cheese plant in Australia that were recorded in 2008. We had $22 million of lower charges from
certain legal
30