Kraft 2010 Annual Report Download - page 5
Download and view the complete annual report
Please find page 5 of the 2010 Kraft annual report below. You can navigate through the pages in the report by either clicking on the pages listed below, or by using the keyword search tool below to find specific information within the annual report.-
 1
1 -
 2
2 -
 3
3 -
 4
4 -
 5
5 -
 6
6 -
 7
7 -
 8
8 -
 9
9 -
 10
10 -
 11
11 -
 12
12 -
 13
13 -
 14
14 -
 15
15 -
 16
16 -
17
-
18
-
19
-
20
-
21
-
22
-
23
-
24
-
25
-
26
-
27
-
28
-
29
-
30
-
31
-
32
-
33
-
34
-
35
-
36
-
37
-
38
-
39
-
40
-
41
-
42
-
43
-
44
-
45
-
46
-
47
-
48
-
49
-
50
-
51
-
52
-
53
-
54
-
55
-
56
-
57
-
58
-
59
-
60
-
61
-
62
-
63
-
64
-
65
-
66
-
67
-
68
-
69
-
70
-
71
-
72
-
73
-
74
-
75
-
76
-
77
-
78
-
79
-
80
-
81
-
82
-
83
-
84
-
85
-
86
-
87
-
88
-
89
-
90
-
91
-
92
-
93
-
94
-
95
-
96
-
97
-
98
-
99
-
100
-
101
-
102
-
103
-
104
-
105
-
106
-
107
-
108
-
109
-
110
-
111
-
112
-
113
-
114
-
115
-
116
-
117
-
118
-
119
-
120
-
121
-
122
-
123
-
124
-
125
-
126
-
127
-
128
-
129
-
130
-
131
-
132
-
133
-
134
-
135
-
136
-
137
-
138
-
139
-
140
-
141
-
142
-
143
-
144
-
145
-
146
-
147
-
148
-
149
-
150
-
151
-
152
-
153
-
154
-
155
-
156
-
157
-
158
-
159
-
160
-
161
-
162
-
163
-
164
-
165
-
166
-
167
-
168
-
169
-
170
-
171
-
172
-
173
-
174
-
175
-
176
-
177
-
178
-
179
-
180
-
181
-
182
-
183
-
184
-
185
-
186
-
187
-
188
-
189
-
190
-
191
-
192
-
193
-
194
-
195
-
196
-
197
-
198
-
199
-
200
-
201
-
202
-
203
-
204
-
205
-
206
-
207
-
208
-
209
-
210
 |
 |

Foods Europe by product category, and we manage the operations of Kraft Foods Developing Markets by location. Our reportable segments are U.S.
Beverages, U.S. Cheese, U.S. Convenient Meals, U.S. Grocery, U.S. Snacks, Canada & North America Foodservice, Kraft Foods Europe and Kraft Foods
Developing Markets. The results of operations from our Cadbury Limited (formerly, Cadbury plc) ("Cadbury") acquisition are reflected within our U.S.
Snacks, Canada & N.A. Foodservice, Kraft Foods Europe and Kraft Foods Developing Markets segments.
Note 16, Segment Reporting, to our consolidated financial statements includes a breakout of net revenues, segment operating income, total assets, depreciation
expense and capital expenditures by reportable segment, as well as a breakout of net revenues, long-lived assets and total assets by geographic region.
Management uses segment operating income to evaluate segment performance and allocate resources. We believe it is appropriate to disclose this measure to
help investors analyze segment performance and trends. Segment operating income excludes unrealized gains and losses on hedging activities (which are a
component of cost of sales), certain components of our U.S. pension plan cost (which is a component of cost of sales and selling, general and administrative
expenses), general corporate expenses (which are a component of selling, general and administrative expenses) and amortization of intangibles.
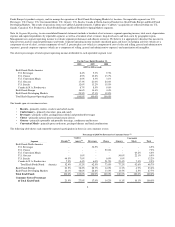
The relative percentages of total segment operating income attributable to each reportable segment were:
For the Years Ended December 31,
2010 2009 2008
(2009 & 2008 revised)
Kraft Foods North America:
U.S. Beverages 8.4% 9.3% 9.3%
U.S. Cheese 8.9% 12.2% 13.7%
U.S. Convenient Meals 4.0% 4.3% 3.1%
U.S. Grocery 17.3% 21.0% 24.6%
U.S. Snacks 12.6% 13.2% 15.5%
Canada & N.A. Foodservice 8.7% 8.5% 9.6%
Kraft Foods Europe 16.6% 14.4% 4.4%
Kraft Foods Developing Markets 23.5% 17.1% 19.8%
Total Kraft Segment Operating Income 100.0% 100.0% 100.0%
Our brands span six consumer sectors:
• Biscuits - primarily cookies, crackers and salted snacks
• Confectionery - primarily chocolate, gum and candy
• Beverages - primarily coffee, packaged juice drinks and powdered beverages
• Cheese - primarily natural, processed and cream cheeses
• Grocery - primarily spoonable and pourable dressings, condiments and desserts
• Convenient Meals - primarily processed meats, packaged dinners and lunch combinations
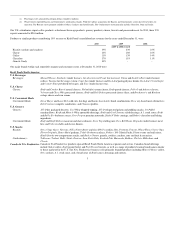
The following table shows each reportable segment's participation in these six core consumer sectors.
Percentage of 2010 Net Revenues by Consumer Sector (1)
Segment Biscuits(2)
Confect-
ionery(2) Beverages Cheese Grocery
Convenient
Meals Total
Kraft Foods North America:
U.S. Beverages - - 36.5% - - - 6.5%
U.S. Cheese - - - 50.6% - - 7.2%
U.S. Convenient Meals - - - - - 63.2% 6.4%
U.S. Grocery - 1.0% - - 54.0% 22.1% 6.9%
U.S. Snacks 44.5% 7.8% - 0.9% 1.8% - 12.2%
Canada & N.A. Foodservice 7.9% 4.4% 6.0% 21.5% 21.4% 7.3% 9.5%
Total Kraft Foods North America 52.4% 13.2% 42.5% 73.0% 77.2% 92.6% 48.7%
Kraft Foods Europe 21.5% 38.2% 28.7% 14.0% 8.3% 4.9% 23.6%
Kraft Foods Developing Markets 26.1% 48.6% 28.8% 13.0% 14.5% 2.5% 27.7%
Total Kraft Foods 100.0% 100.0% 100.0% 100.0% 100.0% 100.0% 100.0%
Consumer Sector Percentage
of Total Kraft Foods 21.9% 27.8% 17.9% 14.2% 8.1% 10.1% 100.0%
2