Kraft 2010 Annual Report Download - page 39
Download and view the complete annual report
Please find page 39 of the 2010 Kraft annual report below. You can navigate through the pages in the report by either clicking on the pages listed below, or by using the keyword search tool below to find specific information within the annual report.-
 1
1 -
2
-
3
-
4
-
5
-
6
-
7
-
8
-
9
-
10
-
11
-
12
-
13
-
14
-
15
-
16
-
17
-
18
-
19
-
20
-
21
-
22
-
23
-
24
-
25
-
26
-
27
-
28
-
 29
29 -
 30
30 -
 31
31 -
 32
32 -
 33
33 -
 34
34 -
 35
35 -
 36
36 -
 37
37 -
 38
38 -
 39
39 -
 40
40 -
 41
41 -
 42
42 -
 43
43 -
 44
44 -
 45
45 -
 46
46 -
 47
47 -
 48
48 -
 49
49 -
50
-
51
-
52
-
53
-
54
-
55
-
56
-
57
-
58
-
59
-
60
-
61
-
62
-
63
-
64
-
65
-
66
-
67
-
68
-
69
-
70
-
71
-
72
-
73
-
74
-
75
-
76
-
77
-
78
-
79
-
80
-
81
-
82
-
83
-
84
-
85
-
86
-
87
-
88
-
89
-
90
-
91
-
92
-
93
-
94
-
95
-
96
-
97
-
98
-
99
-
100
-
101
-
102
-
103
-
104
-
105
-
106
-
107
-
108
-
109
-
110
-
111
-
112
-
113
-
114
-
115
-
116
-
117
-
118
-
119
-
120
-
121
-
122
-
123
-
124
-
125
-
126
-
127
-
128
-
129
-
130
-
131
-
132
-
133
-
134
-
135
-
136
-
137
-
138
-
139
-
140
-
141
-
142
-
143
-
144
-
145
-
146
-
147
-
148
-
149
-
150
-
151
-
152
-
153
-
154
-
155
-
156
-
157
-
158
-
159
-
160
-
161
-
162
-
163
-
164
-
165
-
166
-
167
-
168
-
169
-
170
-
171
-
172
-
173
-
174
-
175
-
176
-
177
-
178
-
179
-
180
-
181
-
182
-
183
-
184
-
185
-
186
-
187
-
188
-
189
-
190
-
191
-
192
-
193
-
194
-
195
-
196
-
197
-
198
-
199
-
200
-
201
-
202
-
203
-
204
-
205
-
206
-
207
-
208
-
209
-
210
 |
 |

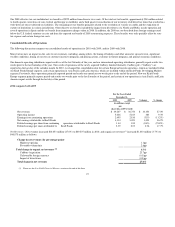
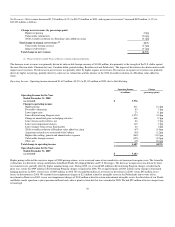
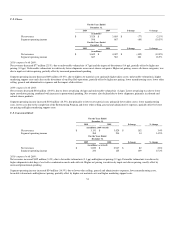
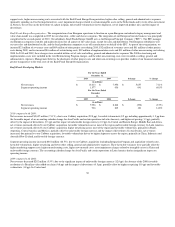
2010 compared with 2009:
Net revenues increased $1,037 million (20.9%), due to our Cadbury acquisition (21.7 pp) and favorable volume/mix (0.5 pp), partially offset by the impact of
divestitures (1.1 pp) and lower net pricing (0.2 pp). Biscuits net revenues decreased, driven by unfavorable volume/mix, partially offset by higher net pricing.
Biscuits unfavorable volume/mix was due primarily to lower shipments in crackers (primarily Wheat Thins, Cheese Nips, Premium and Honey Maid) and
cookies (primarily Newtons and Nutter Butter). Snack nuts net revenues increased, due to favorable volume/mix, driven by higher shipments.
Segment operating income increased $122 million (16.9%), due primarily to our Cadbury acquisition (including Integration Program and acquisition-related
costs), the favorable resolution of a settlement relating to the 2009 pistachio product recall, lower manufacturing costs and lower other selling, general and
administrative expenses. These favorable variances were partially offset by higher raw material costs, higher marketing support costs, unfavorable volume/
mix, the 2009 gain on the divestiture of our Balance bar operations in the U.S., the impact of divestitures and lower net pricing.
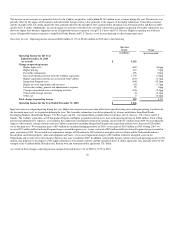
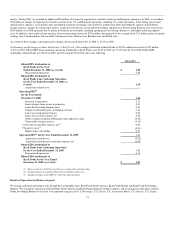
2009 compared with 2008:
Net revenues decreased $61 million (1.2%), due to unfavorable volume/mix (1.7 pp) and the impact of divestitures (0.2 pp), partially offset by higher net
pricing (0.7 pp). Biscuits net revenues increased, driven by higher input cost-driven pricing, partially offset by unfavorable volume/mix (unfavorable product
mix, net of higher shipments). Biscuits volume gain was due to higher shipments primarily in Ritz crackers, Oreo cookies, Triscuit crackers and Chips Ahoy!
cookies. Snack bars net revenues decreased, primarily due to volume declines in breakfast bars. Snack nuts net revenues decreased, primarily driven by lower
net pricing, due to higher promotional spending, and unfavorable volume/mix reflecting lower volume due primarily to the recall of certain products
containing pistachios in March 2009.
Segment operating income increased $85 million (13.3%), due primarily to lower costs due to the completion of the Restructuring Program, lower marketing
support costs, lower manufacturing costs, higher net pricing, the gain on the divestiture of our Balance bar operations in the U.S. and lower other selling,
general and administrative expenses. These favorable factors were partially offset by higher raw material costs and unfavorable volume/mix (unfavorable
product mix and lower shipments, including the recall of certain products containing pistachios).
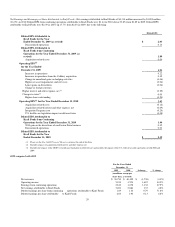
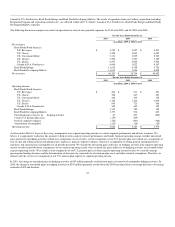
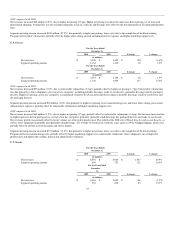
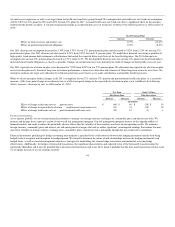
Canada & N.A. Foodservice
For the Years Ended
December 31,
2010 2009 $ change % change
(in millions; 2009 revised)
Net revenues $ 4,696 $ 3,922 $ 774 19.7%
Segment operating income 582 462 120 26.0%
For the Years Ended
December 31,
2009 2008 $ change % change
(in millions; as revised)
Net revenues $ 3,922 $ 4,147 $ (225) (5.4%)
Segment operating income 462 395 67 17.0%
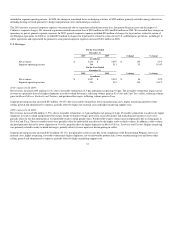
2010 compared with 2009:
Net revenues increased $774 million (19.7%), due to our Cadbury acquisition (11.1 pp), the significant impact of favorable foreign currency (6.4 pp) and
higher net pricing (1.5 pp) and favorable volume/mix (0.8 pp). In Canada, net revenues increased, driven by our Cadbury acquisition, favorable foreign
currency, higher net pricing and favorable volume/mix, driven by higher shipments in its grocery, cheese and convenient meals retail businesses. In N.A.
Foodservice, net revenues increased, driven by higher net pricing and favorable foreign currency, partially offset by unfavorable volume/mix (unfavorable
product mix, net of higher shipments).
Segment operating income increased $120 million (26.0%), due primarily to our Cadbury acquisition(including Integration Program and acquisition-related
costs), higher net pricing, favorable foreign currency, lower manufacturing costs, favorable volume/mix and lower marketing support costs, partially offset by
higher raw material costs and higher other selling, general and administrative expenses.
36