Kraft 2010 Annual Report Download - page 88
Download and view the complete annual report
Please find page 88 of the 2010 Kraft annual report below. You can navigate through the pages in the report by either clicking on the pages listed below, or by using the keyword search tool below to find specific information within the annual report.-
 1
1 -
2
-
3
-
4
-
5
-
6
-
7
-
8
-
9
-
10
-
11
-
12
-
13
-
14
-
15
-
16
-
17
-
18
-
19
-
20
-
21
-
22
-
23
-
24
-
25
-
26
-
27
-
28
-
29
-
30
-
31
-
32
-
33
-
34
-
35
-
36
-
37
-
38
-
39
-
40
-
41
-
42
-
43
-
44
-
45
-
46
-
47
-
48
-
49
-
50
-
51
-
52
-
53
-
54
-
55
-
56
-
57
-
58
-
59
-
60
-
61
-
62
-
63
-
64
-
65
-
66
-
67
-
68
-
69
-
70
-
71
-
72
-
73
-
74
-
75
-
76
-
77
-
 78
78 -
 79
79 -
 80
80 -
 81
81 -
 82
82 -
 83
83 -
 84
84 -
 85
85 -
 86
86 -
 87
87 -
 88
88 -
 89
89 -
 90
90 -
 91
91 -
 92
92 -
 93
93 -
 94
94 -
 95
95 -
 96
96 -
 97
97 -
 98
98 -
99
-
100
-
101
-
102
-
103
-
104
-
105
-
106
-
107
-
108
-
109
-
110
-
111
-
112
-
113
-
114
-
115
-
116
-
117
-
118
-
119
-
120
-
121
-
122
-
123
-
124
-
125
-
126
-
127
-
128
-
129
-
130
-
131
-
132
-
133
-
134
-
135
-
136
-
137
-
138
-
139
-
140
-
141
-
142
-
143
-
144
-
145
-
146
-
147
-
148
-
149
-
150
-
151
-
152
-
153
-
154
-
155
-
156
-
157
-
158
-
159
-
160
-
161
-
162
-
163
-
164
-
165
-
166
-
167
-
168
-
169
-
170
-
171
-
172
-
173
-
174
-
175
-
176
-
177
-
178
-
179
-
180
-
181
-
182
-
183
-
184
-
185
-
186
-
187
-
188
-
189
-
190
-
191
-
192
-
193
-
194
-
195
-
196
-
197
-
198
-
199
-
200
-
201
-
202
-
203
-
204
-
205
-
206
-
207
-
208
-
209
-
210
 |
 |

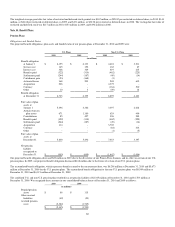
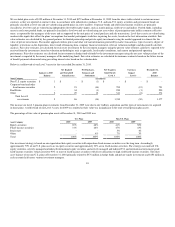
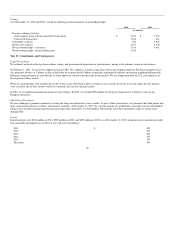
The current portion of our accrued postretirement health care costs of $217 million at December 31, 2010 and $216 million at December 31, 2009 was
included in other accrued liabilities.
We used the following weighted-average assumptions to determine our postretirement benefit obligations at December 31:
U.S. Plans Non-U.S. Plans
2010 2009 2010 2009
Discount rate 5.30% 5.70% 5.02% 5.25%
Health care cost trend rate assumed
for next year 7.50% 7.00% 8.83% 9.00%
Ultimate trend rate 5.00% 5.00% 6.00% 6.00%
Year that the rate reaches the
ultimate trend rate 2016 2014 2017 2016
Year-end discount rates for our U.S. and Canadian plans were developed from a model portfolio of high quality, fixed-income debt instruments
with durations that match the expected future cash flows of the benefit obligations. Year-end discount rates for our non-U.S. plans (other than
Canadian plans) were developed from local bond indices that match local benefit obligations as closely as possible. Changes in our discount rates
were primarily the result of changes in bond yields year-over-year. Our expected health care cost trend rate is based on historical costs.
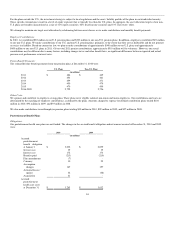
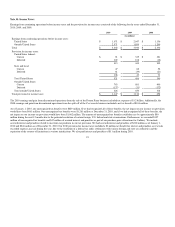
Assumed health care cost trend rates have a significant impact on the amounts reported for the health care plans. A one-percentage-point change in
assumed health care cost trend rates would have the following effects as of December 31, 2010:
One-Percentage-Point
Increase Decrease
Effect on total of service and
interest cost 12.7% (10.4%)
Effect on postretirement benefit
obligation 10.5% (8.8%)
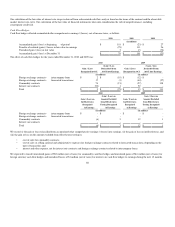
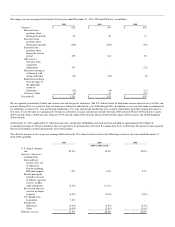
Components of Net Postretirement Health Care Costs:
Net postretirement health care costs consisted of the following for the years ended December 31, 2010, 2009 and 2008:
2010 2009 2008
(in millions)
Service cost $ 39 $ 35 $ 44
Interest cost 172 174 183
Amortization:
Net loss from experience differences 55 44 55
Prior service credit (32) (32) (28)
Other expense - - -
Net postretirement health care costs $ 234 $ 221 $ 254
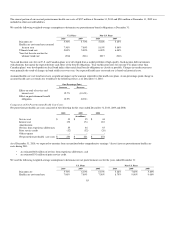
As of December 31, 2010, we expected to amortize from accumulated other comprehensive earnings / (losses) into net postretirement health care
costs during 2011:
• an estimated $64 million of net loss from experience differences; and
• an estimated $31 million of prior service credit.
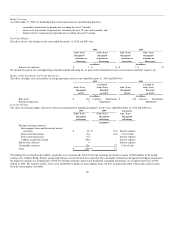
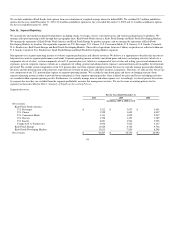
We used the following weighted-average assumptions to determine our net postretirement cost for the years ended December 31:
U.S. Plans Non-U.S. Plans
2010 2009 2008 2010 2009 2008
Discount rate 5.70% 6.10% 6.10% 5.28% 7.60% 5.80%
Health care cost trend rate 7.00% 7.00% 7.50% 8.79% 9.00% 9.00%
85