Kraft 2010 Annual Report Download - page 54
Download and view the complete annual report
Please find page 54 of the 2010 Kraft annual report below. You can navigate through the pages in the report by either clicking on the pages listed below, or by using the keyword search tool below to find specific information within the annual report.-
 1
1 -
2
-
3
-
4
-
5
-
6
-
7
-
8
-
9
-
10
-
11
-
12
-
13
-
14
-
15
-
16
-
17
-
18
-
19
-
20
-
21
-
22
-
23
-
24
-
25
-
26
-
27
-
28
-
29
-
30
-
31
-
32
-
33
-
34
-
35
-
36
-
37
-
38
-
39
-
40
-
41
-
42
-
43
-
 44
44 -
 45
45 -
 46
46 -
 47
47 -
 48
48 -
 49
49 -
 50
50 -
 51
51 -
 52
52 -
 53
53 -
 54
54 -
 55
55 -
 56
56 -
 57
57 -
 58
58 -
 59
59 -
 60
60 -
 61
61 -
 62
62 -
 63
63 -
 64
64 -
65
-
66
-
67
-
68
-
69
-
70
-
71
-
72
-
73
-
74
-
75
-
76
-
77
-
78
-
79
-
80
-
81
-
82
-
83
-
84
-
85
-
86
-
87
-
88
-
89
-
90
-
91
-
92
-
93
-
94
-
95
-
96
-
97
-
98
-
99
-
100
-
101
-
102
-
103
-
104
-
105
-
106
-
107
-
108
-
109
-
110
-
111
-
112
-
113
-
114
-
115
-
116
-
117
-
118
-
119
-
120
-
121
-
122
-
123
-
124
-
125
-
126
-
127
-
128
-
129
-
130
-
131
-
132
-
133
-
134
-
135
-
136
-
137
-
138
-
139
-
140
-
141
-
142
-
143
-
144
-
145
-
146
-
147
-
148
-
149
-
150
-
151
-
152
-
153
-
154
-
155
-
156
-
157
-
158
-
159
-
160
-
161
-
162
-
163
-
164
-
165
-
166
-
167
-
168
-
169
-
170
-
171
-
172
-
173
-
174
-
175
-
176
-
177
-
178
-
179
-
180
-
181
-
182
-
183
-
184
-
185
-
186
-
187
-
188
-
189
-
190
-
191
-
192
-
193
-
194
-
195
-
196
-
197
-
198
-
199
-
200
-
201
-
202
-
203
-
204
-
205
-
206
-
207
-
208
-
209
-
210
 |
 |

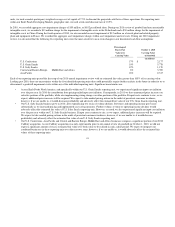
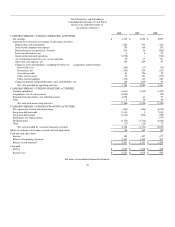
Dividends:
We paid dividends of $2,175 million in 2010, $1,712 million in 2009, and $1,663 million in 2008. The increase of 27.0% in 2010 reflects an increase in shares
outstanding due to the Cadbury acquisition and the $224 million payment of a ten pence per share dividend that Cadbury declared and accrued on the Cadbury
shares that were outstanding at the time of the acquisition. The 2.9% increase in 2009 reflects a higher dividend rate, partially offset by fewer shares
outstanding resulting from the split-off of the Post cereals business and share repurchases. The present annualized dividend rate is $1.16 per common share.
The declaration of dividends is subject to the discretion of our Board of Directors and depends on various factors, including our net earnings, financial
condition, cash requirements, future prospects and other factors that our Board of Directors deems relevant to its analysis and decision making.
2011 Outlook
Our outlook for 2011 reflects confidence in continuing our strong business momentum in a challenging environment of weak consumer and category growth
as well as significant input cost inflation.
The company expects to deliver organic net revenue growth of at least 5 percent, or approximately 4 percent excluding the impact of accounting calendar
changes, and Operating EPS growth of 11 to 13 percent.
New Accounting Guidance
See Note 1, Summary of Significant Accounting Policies, to the consolidated financial statements for a discussion of new accounting standards.
Contingencies
See Note 13, Commitments and Contingencies, to the consolidated financial statements.
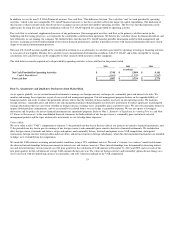
Non-GAAP Financial Measures
We use the non-U.S. GAAP financial measure "organic net revenues" and corresponding growth ratios. The difference between "organic net revenues" and
"net revenues," which is the most comparable U.S. GAAP financial measure, is that organic net revenues excludes the impact of acquisitions, divestitures and
currency. Management uses organic net revenues to budget, make operating and strategic decisions and evaluate our performance. We have disclosed this
measure so that you have the same financial data that management uses with the intention of assisting you in making comparisons to our historical operating
results and analyzing our underlying performance. Our management believes that organic net revenues better reflect the underlying growth from the ongoing
activities of our business and provide improved comparability of results because they exclude the impact of fluctuations in foreign currency exchange rates,
which are not under our control, and also exclude the one-time impacts of acquisitions and divestitures on net revenues. The limitation of this measure is that
it excludes items that have an impact on net revenues. The best way that this limitation can be addressed is by using organic net revenues in combination with
our U.S. GAAP reported net revenues. Our management believes that the presentation of this non-U.S. GAAP financial measure, when considered together
with our U.S. GAAP financial measures and the reconciliations to the corresponding U.S. GAAP financial measures, provides you with a more complete
understanding of the factors and trends affecting Kraft Foods than could be obtained absent these disclosures. Because organic net revenues calculations may
vary among other companies, the organic net revenues figures presented in the Consolidated Results of Operations section may not be comparable to similarly
titled measures used by other companies. Our use of organic net revenues is not meant to be considered in isolation or as a substitute for any U.S. GAAP
financial measure. You should carefully evaluate the following tables reconciling U.S. GAAP reported net revenues to organic net revenues.
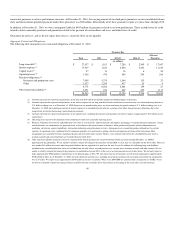
2010 2009 $ Change % Change
(in millions; 2009 revised)
Organic net revenues $ 40,075 $ 38,645 $ 1,430 3.7%
Impact of divestitures 21 109 (88) (0.3)pp
Impact of acquisitions 9,143 - 9,143 23.7pp
Impact of integration (1) - (1) -
Impact of foreign currency (31) - (31) (0.1)pp
Reported net revenues $ 49,207 $ 38,754 $ 10,453 27.0%
51