Kraft 2010 Annual Report Download - page 58
Download and view the complete annual report
Please find page 58 of the 2010 Kraft annual report below. You can navigate through the pages in the report by either clicking on the pages listed below, or by using the keyword search tool below to find specific information within the annual report.-
 1
1 -
2
-
3
-
4
-
5
-
6
-
7
-
8
-
9
-
10
-
11
-
12
-
13
-
14
-
15
-
16
-
17
-
18
-
19
-
20
-
21
-
22
-
23
-
24
-
25
-
26
-
27
-
28
-
29
-
30
-
31
-
32
-
33
-
34
-
35
-
36
-
37
-
38
-
39
-
40
-
41
-
42
-
43
-
44
-
45
-
46
-
47
-
 48
48 -
 49
49 -
 50
50 -
 51
51 -
 52
52 -
 53
53 -
 54
54 -
 55
55 -
 56
56 -
 57
57 -
 58
58 -
 59
59 -
 60
60 -
 61
61 -
 62
62 -
 63
63 -
 64
64 -
 65
65 -
 66
66 -
 67
67 -
 68
68 -
69
-
70
-
71
-
72
-
73
-
74
-
75
-
76
-
77
-
78
-
79
-
80
-
81
-
82
-
83
-
84
-
85
-
86
-
87
-
88
-
89
-
90
-
91
-
92
-
93
-
94
-
95
-
96
-
97
-
98
-
99
-
100
-
101
-
102
-
103
-
104
-
105
-
106
-
107
-
108
-
109
-
110
-
111
-
112
-
113
-
114
-
115
-
116
-
117
-
118
-
119
-
120
-
121
-
122
-
123
-
124
-
125
-
126
-
127
-
128
-
129
-
130
-
131
-
132
-
133
-
134
-
135
-
136
-
137
-
138
-
139
-
140
-
141
-
142
-
143
-
144
-
145
-
146
-
147
-
148
-
149
-
150
-
151
-
152
-
153
-
154
-
155
-
156
-
157
-
158
-
159
-
160
-
161
-
162
-
163
-
164
-
165
-
166
-
167
-
168
-
169
-
170
-
171
-
172
-
173
-
174
-
175
-
176
-
177
-
178
-
179
-
180
-
181
-
182
-
183
-
184
-
185
-
186
-
187
-
188
-
189
-
190
-
191
-
192
-
193
-
194
-
195
-
196
-
197
-
198
-
199
-
200
-
201
-
202
-
203
-
204
-
205
-
206
-
207
-
208
-
209
-
210
 |
 |

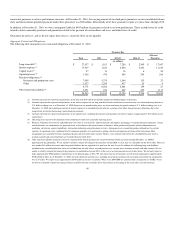
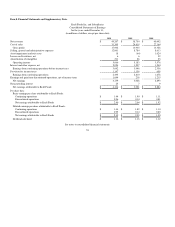
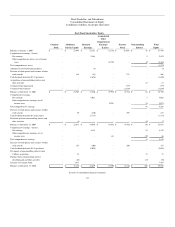
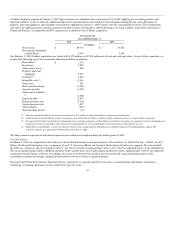
Item 8. Financial Statements and Supplementary Data.
Kraft Foods Inc. and Subsidiaries
Consolidated Statements of Earnings
for the years ended December 31,
(in millions of dollars, except per share data)
2010 2009 2008
Net revenues $ 49,207 $ 38,754 $ 40,492
Cost of sales 31,305 24,819 27,164
Gross profit 17,902 13,935 13,328
Selling, general and administrative expenses 12,001 8,784 8,613
Asset impairment and exit costs 18 (64) 1,024
Losses on divestitures, net 6 6 92
Amortization of intangibles 211 26 23
Operating income 5,666 5,183 3,576
Interest and other expense, net 2,024 1,237 1,240
Earnings from continuing operations before income taxes 3,642 3,946 2,336
Provision for income taxes 1,147 1,136 658
Earnings from continuing operations 2,495 2,810 1,678
Earnings and gain from discontinued operations, net of income taxes 1,644 218 1,215
Net earnings 4,139 3,028 2,893
Noncontrolling interest 25 7 9
Net earnings attributable to Kraft Foods $ 4,114 $ 3,021 $ 2,884
Per share data:
Basic earnings per share attributable to Kraft Foods:
Continuing operations $ 1.44 $ 1.90 $ 1.11
Discontinued operations 0.96 0.14 0.81
Net earnings attributable to Kraft Foods $ 2.40 $ 2.04 $ 1.92
Diluted earnings per share attributable to Kraft Foods:
Continuing operations $ 1.44 $ 1.89 $ 1.10
Discontinued operations 0.95 0.14 0.80
Net earnings attributable to Kraft Foods $ 2.39 $ 2.03 $ 1.90
Dividends declared $ 1.16 $ 1.16 $ 1.12
See notes to consolidated financial statements.
55