Kraft 2010 Annual Report Download - page 32
Download and view the complete annual report
Please find page 32 of the 2010 Kraft annual report below. You can navigate through the pages in the report by either clicking on the pages listed below, or by using the keyword search tool below to find specific information within the annual report.-
 1
1 -
2
-
3
-
4
-
5
-
6
-
7
-
8
-
9
-
10
-
11
-
12
-
13
-
14
-
15
-
16
-
17
-
18
-
19
-
20
-
21
-
 22
22 -
 23
23 -
 24
24 -
 25
25 -
 26
26 -
 27
27 -
 28
28 -
 29
29 -
 30
30 -
 31
31 -
 32
32 -
 33
33 -
 34
34 -
 35
35 -
 36
36 -
 37
37 -
 38
38 -
 39
39 -
 40
40 -
 41
41 -
 42
42 -
43
-
44
-
45
-
46
-
47
-
48
-
49
-
50
-
51
-
52
-
53
-
54
-
55
-
56
-
57
-
58
-
59
-
60
-
61
-
62
-
63
-
64
-
65
-
66
-
67
-
68
-
69
-
70
-
71
-
72
-
73
-
74
-
75
-
76
-
77
-
78
-
79
-
80
-
81
-
82
-
83
-
84
-
85
-
86
-
87
-
88
-
89
-
90
-
91
-
92
-
93
-
94
-
95
-
96
-
97
-
98
-
99
-
100
-
101
-
102
-
103
-
104
-
105
-
106
-
107
-
108
-
109
-
110
-
111
-
112
-
113
-
114
-
115
-
116
-
117
-
118
-
119
-
120
-
121
-
122
-
123
-
124
-
125
-
126
-
127
-
128
-
129
-
130
-
131
-
132
-
133
-
134
-
135
-
136
-
137
-
138
-
139
-
140
-
141
-
142
-
143
-
144
-
145
-
146
-
147
-
148
-
149
-
150
-
151
-
152
-
153
-
154
-
155
-
156
-
157
-
158
-
159
-
160
-
161
-
162
-
163
-
164
-
165
-
166
-
167
-
168
-
169
-
170
-
171
-
172
-
173
-
174
-
175
-
176
-
177
-
178
-
179
-
180
-
181
-
182
-
183
-
184
-
185
-
186
-
187
-
188
-
189
-
190
-
191
-
192
-
193
-
194
-
195
-
196
-
197
-
198
-
199
-
200
-
201
-
202
-
203
-
204
-
205
-
206
-
207
-
208
-
209
-
210
 |
 |

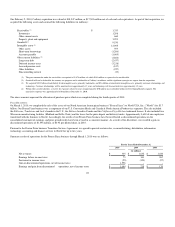
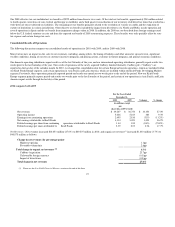
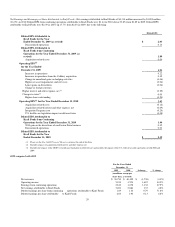
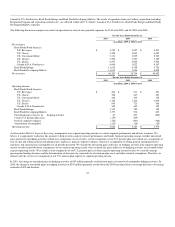
Net Earnings and Earnings per Share Attributable to Kraft Foods - Net earnings attributable to Kraft Foods of $4,114 million increased by $1,093 million
(36.2%) in 2010. Diluted EPS from continuing operations attributable to Kraft Foods were $1.44 in 2010, down 23.8% from $1.89 in 2009. Diluted EPS
attributable to Kraft Foods were $2.39 in 2010, up 17.7% from $2.03 in 2009, due to the following:
Diluted EPS
Diluted EPS Attributable to
Kraft Foods for the Year
Ended December 31, 2009 (as revised) $ 2.03
Discontinued operations 0.14
Diluted EPS Attributable to
Kraft Foods from Continuing
Operations for the Year Ended December 31, 2009 (as
revised) 1.89
Acquisition-related costs 0.04
Operating EPS(1)
for the Year Ended
December 31, 2009 1.93
Increases in operations 0.22
Increases in operations from the Cadbury acquisition 0.45
Change in unrealized gains on hedging activities (0.06)
Higher net asset impairments and exit costs (0.04)
Lower gains on divestitures (0.04)
Change in foreign currency -
Higher interest and other expense, net (2) (0.25)
Changes in taxes(3) 0.05
Higher shares outstanding (0.24)
Operating EPS(1) for the Year Ended December 31, 2010 2.02
Acquisition-related costs (0.12)
Acquisition-related interest and other expense, net (0.09)
Integration Program costs (0.29)
U.S. health care legislation impact on deferred taxes (0.08)
Diluted EPS Attributable to
Kraft Foods from Continuing
Operations for the Year Ended December 31, 2010 1.44
2010 gain on the divestiture of our Frozen Pizza business 0.92
Discontinued operations 0.03
Diluted EPS Attributable to
Kraft Foods for the Year
Ended December 31, 2010 $ 2.39
(1) Please see the Non-GAAP Financial Measures section at the end of this Item.
(2) Excludes impacts of acquisition-related interest and other expense, net.
(3) Excludes the impacts of the 2010 U.S. health care legislation on deferred taxes and includes the impacts of the U.S. federal tax audit agreements in both 2010 and
2009.
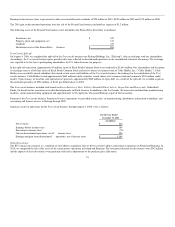
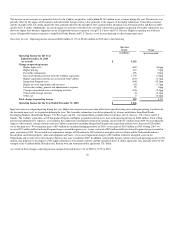
2009 compared with 2008
For the Years Ended
December 31,
2009 2008 $ change % change
(in millions, except per
share data; as revised)
Net revenues $ 38,754 $ 40,492 $ (1,738) (4.3%)
Operating income 5,183 3,576 1,607 44.9%
Earnings from continuing operations 2,810 1,678 1,132 67.5%
Net earnings attributable to Kraft Foods 3,021 2,884 137 4.8%
Diluted earnings per share from continuing operations attributable to Kraft Foods 1.89 1.10 0.79 71.8%
Diluted earnings per share attributable to Kraft Foods 2.03 1.90 0.13 6.8%
29