Kraft 2010 Annual Report Download - page 31
Download and view the complete annual report
Please find page 31 of the 2010 Kraft annual report below. You can navigate through the pages in the report by either clicking on the pages listed below, or by using the keyword search tool below to find specific information within the annual report.-
 1
1 -
2
-
3
-
4
-
5
-
6
-
7
-
8
-
9
-
10
-
11
-
12
-
13
-
14
-
15
-
16
-
17
-
18
-
19
-
20
-
 21
21 -
 22
22 -
 23
23 -
 24
24 -
 25
25 -
 26
26 -
 27
27 -
 28
28 -
 29
29 -
 30
30 -
 31
31 -
 32
32 -
 33
33 -
 34
34 -
 35
35 -
 36
36 -
 37
37 -
 38
38 -
 39
39 -
 40
40 -
 41
41 -
42
-
43
-
44
-
45
-
46
-
47
-
48
-
49
-
50
-
51
-
52
-
53
-
54
-
55
-
56
-
57
-
58
-
59
-
60
-
61
-
62
-
63
-
64
-
65
-
66
-
67
-
68
-
69
-
70
-
71
-
72
-
73
-
74
-
75
-
76
-
77
-
78
-
79
-
80
-
81
-
82
-
83
-
84
-
85
-
86
-
87
-
88
-
89
-
90
-
91
-
92
-
93
-
94
-
95
-
96
-
97
-
98
-
99
-
100
-
101
-
102
-
103
-
104
-
105
-
106
-
107
-
108
-
109
-
110
-
111
-
112
-
113
-
114
-
115
-
116
-
117
-
118
-
119
-
120
-
121
-
122
-
123
-
124
-
125
-
126
-
127
-
128
-
129
-
130
-
131
-
132
-
133
-
134
-
135
-
136
-
137
-
138
-
139
-
140
-
141
-
142
-
143
-
144
-
145
-
146
-
147
-
148
-
149
-
150
-
151
-
152
-
153
-
154
-
155
-
156
-
157
-
158
-
159
-
160
-
161
-
162
-
163
-
164
-
165
-
166
-
167
-
168
-
169
-
170
-
171
-
172
-
173
-
174
-
175
-
176
-
177
-
178
-
179
-
180
-
181
-
182
-
183
-
184
-
185
-
186
-
187
-
188
-
189
-
190
-
191
-
192
-
193
-
194
-
195
-
196
-
197
-
198
-
199
-
200
-
201
-
202
-
203
-
204
-
205
-
206
-
207
-
208
-
209
-
210
 |
 |

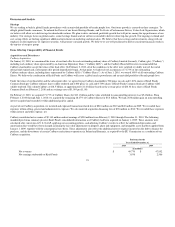
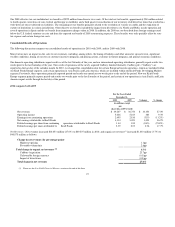
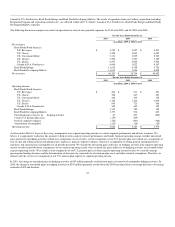
The increase in net revenues was primarily driven by the Cadbury acquisition, which added $9,143 million in net revenues during the year. The increase was
partially offset by the impact of divestitures and unfavorable foreign currency, due primarily to the impacts of the highly inflationary Venezuelan economy
and the strength of the U.S. dollar against the euro, partially offset by the strength of the Canadian dollar, Brazilian real, Australian dollar and Russian ruble
against the U.S. dollar. Additionally, increased organic net revenues were driven by favorable volume/mix and higher net pricing. Favorable volume/mix was
driven by higher base business shipments across all reportable business segments, except U.S. Cheese and U.S. Grocery. Higher net pricing was reflected
across all reportable business segments, except Kraft Foods Europe and U.S. Snacks, as we increased pricing to offset higher input costs.
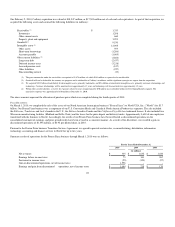
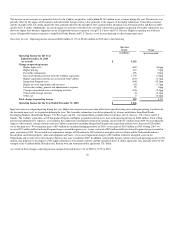
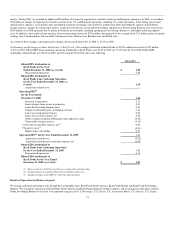
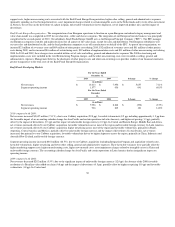
Operating Income - Operating income increased $483 million (9.3%) to $5,666 million in 2010, due to the following:
Operating
Income Change
(in millions) (percentage point)
Operating Income for the Year
Ended December 31, 2009
(as revised) $ 5,183
Change in operating income
Higher input costs (487) (8.6)pp
Higher pricing 412 7.4pp
Favorable volume/mix 495 8.9pp
Increased operating income from the Cadbury acquisition 1,139 21.8pp
Higher acquisition-related costs associated with Cadbury (233) (4.3)pp
Integration Program costs (646) (12.5)pp
Higher net asset impairment and exit costs (82) (1.7)pp
Lower other selling, general and administrative expense 25 1.0pp
Change in unrealized losses on hedging activities (136) (2.4)pp
Unfavorable foreign currency (8) (0.1)pp
Other, net 4 (0.2)pp
Total change in operating income 483 9.3%
Operating Income for the Year Ended December 31, 2010 $ 5,666
Input cost increases outpaced pricing during the year. Higher raw material costs more than offset lower manufacturing costs and higher pricing was driven by
the increased input costs we experienced during the year. The favorable volume/mix was driven primarily by strong contributions from Kraft Foods
Developing Markets, Kraft Foods Europe, U.S. Beverages and U.S. Convenient Meals, partially offset by declines in U.S. Grocery, U.S. Cheese and U.S.
Snacks. The Cadbury acquisition, net of Integration Program and higher acquisition-related costs, increased operating income by $260 million. Total selling,
general and administrative expenses, as recorded in the condensed consolidated statement of earnings, increased $3,217 million from 2009, but excluding the
impacts of divestitures, foreign currency and our Cadbury acquisition (including Integration Program and acquisition-related costs), decreased $25 million
versus the prior year. We recognized gains of $67 million in unrealized hedging positions in 2010, versus gains of $203 million in 2009. During 2010, we
reversed $37 million in Restructuring Program charges recorded in prior years, versus a reversal of $85 million in Restructuring Program charges recorded in
prior years during 2009. We recorded asset impairment charges of $55 million in 2010 related to intangible assets in China and the Netherlands and on a
biscuit plant and related property, plant and equipment in France, versus asset impairment charges of $21 million related to intangible assets in the
Netherlands and to write off an investment in Norway that were recorded in 2009. In addition, unfavorable foreign currency decreased operating income by $8
million, due primarily to the impacts of the highly inflationary Venezuelan economy and the strength of the U.S. dollar against the euro, partially offset by the
strength of the Canadian dollar, Brazilian real, Korean won and Australian dollar against the U.S. dollar.
As a result of these changes, operating income margin decreased from 13.4% in 2009 to 11.5% in 2010.
28