Kraft 2010 Annual Report Download - page 49
Download and view the complete annual report
Please find page 49 of the 2010 Kraft annual report below. You can navigate through the pages in the report by either clicking on the pages listed below, or by using the keyword search tool below to find specific information within the annual report.-
 1
1 -
2
-
3
-
4
-
5
-
6
-
7
-
8
-
9
-
10
-
11
-
12
-
13
-
14
-
15
-
16
-
17
-
18
-
19
-
20
-
21
-
22
-
23
-
24
-
25
-
26
-
27
-
28
-
29
-
30
-
31
-
32
-
33
-
34
-
35
-
36
-
37
-
38
-
 39
39 -
 40
40 -
 41
41 -
 42
42 -
 43
43 -
 44
44 -
 45
45 -
 46
46 -
 47
47 -
 48
48 -
 49
49 -
 50
50 -
 51
51 -
 52
52 -
 53
53 -
 54
54 -
 55
55 -
 56
56 -
 57
57 -
 58
58 -
 59
59 -
60
-
61
-
62
-
63
-
64
-
65
-
66
-
67
-
68
-
69
-
70
-
71
-
72
-
73
-
74
-
75
-
76
-
77
-
78
-
79
-
80
-
81
-
82
-
83
-
84
-
85
-
86
-
87
-
88
-
89
-
90
-
91
-
92
-
93
-
94
-
95
-
96
-
97
-
98
-
99
-
100
-
101
-
102
-
103
-
104
-
105
-
106
-
107
-
108
-
109
-
110
-
111
-
112
-
113
-
114
-
115
-
116
-
117
-
118
-
119
-
120
-
121
-
122
-
123
-
124
-
125
-
126
-
127
-
128
-
129
-
130
-
131
-
132
-
133
-
134
-
135
-
136
-
137
-
138
-
139
-
140
-
141
-
142
-
143
-
144
-
145
-
146
-
147
-
148
-
149
-
150
-
151
-
152
-
153
-
154
-
155
-
156
-
157
-
158
-
159
-
160
-
161
-
162
-
163
-
164
-
165
-
166
-
167
-
168
-
169
-
170
-
171
-
172
-
173
-
174
-
175
-
176
-
177
-
178
-
179
-
180
-
181
-
182
-
183
-
184
-
185
-
186
-
187
-
188
-
189
-
190
-
191
-
192
-
193
-
194
-
195
-
196
-
197
-
198
-
199
-
200
-
201
-
202
-
203
-
204
-
205
-
206
-
207
-
208
-
209
-
210
 |
 |

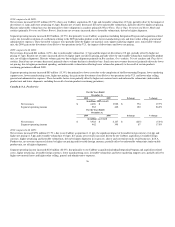
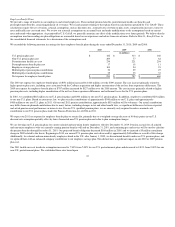
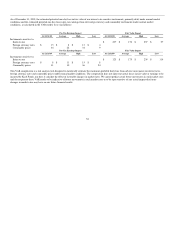
currencies and consumer demand for coffee products. Green coffee bean costs on average were higher in 2010 than in 2009. Significant cost items in our
biscuit and grocery products are grains (wheat, corn and soybean oil). Grain costs have experienced significant volatility as a result of burgeoning global
demand for food, livestock feed and biofuels such as ethanol and biodiesel. Grain costs on average decreased from 2009 to 2010.
During 2010, our aggregate commodity costs increased primarily as a result of higher cocoa, sugar, dairy, coffee and meat costs, partially offset by lower
grain costs. For 2010, our commodity costs were approximately $1.0 billion higher than 2009, following a decrease of approximately $150 million in 2009
compared to 2008. Overall, we expect commodity costs to continue to be volatile and to further increase in 2011.
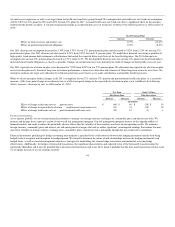
Liquidity
We believe that our cash from operations, our existing $4.5 billion revolving credit facility (which supports our commercial paper program) and our
authorized long-term financing will provide sufficient liquidity to meet our working capital needs, planned capital expenditures, future contractual obligations
and payment of our anticipated quarterly dividends. We continue to utilize our commercial paper program and primarily uncommitted international credit
lines for regular funding requirements. We also use short-term intercompany loans from foreign subsidiaries to improve financial flexibility. Overall, we do
not expect any negative effects to our funding sources that would have a material effect on our liquidity.
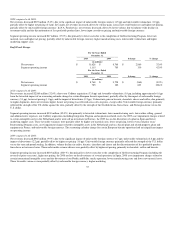
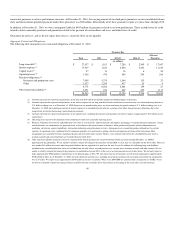
Net Cash Provided by Operating Activities:
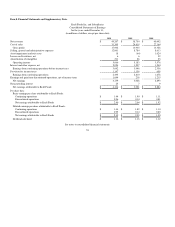
Operating activities provided net cash of $3.7 billion in 2010, $5.1 billion in 2009, and $4.1 billion in 2008. The decrease in operating cash flows in 2010
primarily related to estimated tax payments on the Frozen Pizza divestiture, increased inventory levels and the unfavorable impact of acquisition-related
financing fees, partially offset by increased earnings.
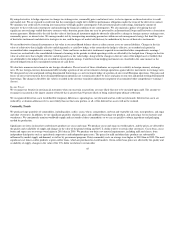
The increase in operating cash flows in 2009 primarily related to working capital improvements over the prior year. The capital improvements were primarily
due to improved inventory positions, partially offset by higher interest payments, principally due to the first annual payment on our euro notes. Additionally,
higher earnings also attributed to an increase in operating cash flows. The increase in operating cash flows was partially offset by higher pension
contributions, driven by total voluntary contributions of $400 million that we made to our U.S. pension plans in May and December 2009.
We anticipate making U.S. pension contributions of approximately $540 million in 2011 and non-U.S. pension contributions of approximately $400 million in
2011. We expect to fund these contributions from operations.
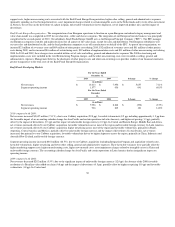
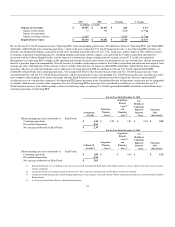
Net Cash Used in Investing Activities:
Net cash used in investing activities was $7.5 billion in 2010, $1.2 billion in 2009, and $1.3 billion in 2008. The increase in cash used in investing activities in
2010 primarily related to the Cadbury acquisition, partially offset by higher proceeds from divestitures. The decrease in cash used in investing activities in
2009 primarily related to a $99 million payment made to Groupe Danone S.A. in 2008 to refund excess cash received in the acquisition of LU Biscuit and
lower capital expenditures, partially offset by lower proceeds from divestitures.
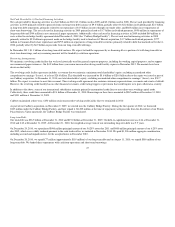
During 2010, we paid $9.8 billion in net cash for the Cadbury acquisition, and we received $3.7 billion in proceeds from the sale of the Frozen Pizza business
and $0.3 billion in proceeds from the divestitures in Poland and Romania. During 2009, we divested our Balance bar operations in the U.S., a juice operation
in Brazil and a plant in Spain and received $41 million in net proceeds. During 2008, we received $153 million in net proceeds on divestitures, primarily
related to a Nordic and Baltic snacks operation and four operations in Spain, and we disbursed $56 million for transaction fees related to the split-off of the
Post cereals business. Additionally, we paid Groupe Danone S.A. the aforementioned refund in 2008.
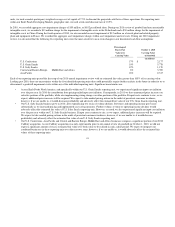
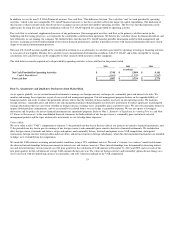
Capital expenditures, which were funded by operating activities, were $1.7 billion in 2010, $1.3 billion in 2009, and $1.4 billion in 2008. Cadbury accounted
for approximately $440 million of the capital expenditures in 2010. The 2010 capital expenditures were primarily used to modernize manufacturing facilities
and support new product and productivity initiatives. We expect 2011 capital expenditures to be approximately $1.8 billion, including capital expenditures
required for systems investments and the Integration Program. We expect to fund these expenditures from operations.
46