Kraft 2010 Annual Report Download - page 71
Download and view the complete annual report
Please find page 71 of the 2010 Kraft annual report below. You can navigate through the pages in the report by either clicking on the pages listed below, or by using the keyword search tool below to find specific information within the annual report.-
 1
1 -
2
-
3
-
4
-
5
-
6
-
7
-
8
-
9
-
10
-
11
-
12
-
13
-
14
-
15
-
16
-
17
-
18
-
19
-
20
-
21
-
22
-
23
-
24
-
25
-
26
-
27
-
28
-
29
-
30
-
31
-
32
-
33
-
34
-
35
-
36
-
37
-
38
-
39
-
40
-
41
-
42
-
43
-
44
-
45
-
46
-
47
-
48
-
49
-
50
-
51
-
52
-
53
-
54
-
55
-
56
-
57
-
58
-
59
-
60
-
 61
61 -
 62
62 -
 63
63 -
 64
64 -
 65
65 -
 66
66 -
 67
67 -
 68
68 -
 69
69 -
 70
70 -
 71
71 -
 72
72 -
 73
73 -
 74
74 -
 75
75 -
 76
76 -
 77
77 -
 78
78 -
 79
79 -
 80
80 -
 81
81 -
82
-
83
-
84
-
85
-
86
-
87
-
88
-
89
-
90
-
91
-
92
-
93
-
94
-
95
-
96
-
97
-
98
-
99
-
100
-
101
-
102
-
103
-
104
-
105
-
106
-
107
-
108
-
109
-
110
-
111
-
112
-
113
-
114
-
115
-
116
-
117
-
118
-
119
-
120
-
121
-
122
-
123
-
124
-
125
-
126
-
127
-
128
-
129
-
130
-
131
-
132
-
133
-
134
-
135
-
136
-
137
-
138
-
139
-
140
-
141
-
142
-
143
-
144
-
145
-
146
-
147
-
148
-
149
-
150
-
151
-
152
-
153
-
154
-
155
-
156
-
157
-
158
-
159
-
160
-
161
-
162
-
163
-
164
-
165
-
166
-
167
-
168
-
169
-
170
-
171
-
172
-
173
-
174
-
175
-
176
-
177
-
178
-
179
-
180
-
181
-
182
-
183
-
184
-
185
-
186
-
187
-
188
-
189
-
190
-
191
-
192
-
193
-
194
-
195
-
196
-
197
-
198
-
199
-
200
-
201
-
202
-
203
-
204
-
205
-
206
-
207
-
208
-
209
-
210
 |
 |

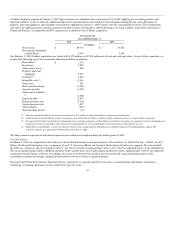
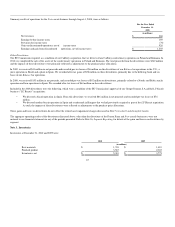
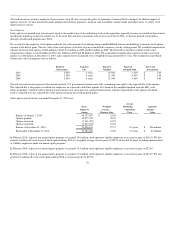
Note 4. Property, Plant and Equipment:
Property, plant and equipment at December 31, 2010 and 2009 were:
2010 2009
(in millions)
Land and land improvements $ 795 $ 492
Buildings and building equipment 4,934 4,231
Machinery and equipment 16,147 13,872
Construction in progress 1,154 828
23,030 19,423
Accumulated depreciation (9,238) (8,730)
Property, plant and equipment, net $ 13,792 $ 10,693
Refer to Note 5, Goodwill and Intangible Assets, for asset impairment charges taken against property, plant and equipment.
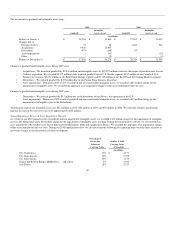
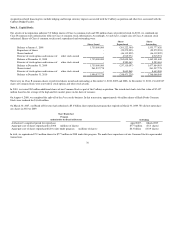
Note 5. Goodwill and Intangible Assets:
At December 31, 2010 and 2009, goodwill by reportable segment was:
2010 2009
(in millions)
Kraft Foods North America:
U.S. Beverages $ 1,290 $ 1,290
U.S. Cheese 3,000 3,000
U.S. Convenient Meals 985 1,460
U.S. Grocery 3,046 3,046
U.S. Snacks 9,125 6,948
Canada & N.A. Foodservice 3,430 2,340
Kraft Foods Europe 9,023 6,756
Kraft Foods Developing Markets 7,957 3,924
Total goodwill $ 37,856 $ 28,764
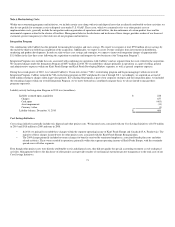
Intangible assets at December 31, 2010 and 2009 were:
2010 2009
(in millions)
Non-amortizable intangible assets $ 23,351 $ 13,262
Amortizable intangible assets 2,928 278
26,279 13,540
Accumulated amortization (316) (111)
Intangible assets, net $ 25,963 $ 13,429
Non-amortizable intangible assets consist principally of brand names purchased through our acquisitions of Nabisco Holdings Corp., LU Biscuit and the
Spanish and Portuguese operations of United Biscuits and Cadbury. Amortizable intangible assets consist primarily of trademark licenses, customer-related
intangibles, process technology, license agreements and non-compete agreements. At December 31, 2010, the weighted-average life of our amortizable
intangible assets was 13.2 years.
68