Kraft 2010 Annual Report Download - page 40
Download and view the complete annual report
Please find page 40 of the 2010 Kraft annual report below. You can navigate through the pages in the report by either clicking on the pages listed below, or by using the keyword search tool below to find specific information within the annual report.-
 1
1 -
2
-
3
-
4
-
5
-
6
-
7
-
8
-
9
-
10
-
11
-
12
-
13
-
14
-
15
-
16
-
17
-
18
-
19
-
20
-
21
-
22
-
23
-
24
-
25
-
26
-
27
-
28
-
29
-
 30
30 -
 31
31 -
 32
32 -
 33
33 -
 34
34 -
 35
35 -
 36
36 -
 37
37 -
 38
38 -
 39
39 -
 40
40 -
 41
41 -
 42
42 -
 43
43 -
 44
44 -
 45
45 -
 46
46 -
 47
47 -
 48
48 -
 49
49 -
 50
50 -
51
-
52
-
53
-
54
-
55
-
56
-
57
-
58
-
59
-
60
-
61
-
62
-
63
-
64
-
65
-
66
-
67
-
68
-
69
-
70
-
71
-
72
-
73
-
74
-
75
-
76
-
77
-
78
-
79
-
80
-
81
-
82
-
83
-
84
-
85
-
86
-
87
-
88
-
89
-
90
-
91
-
92
-
93
-
94
-
95
-
96
-
97
-
98
-
99
-
100
-
101
-
102
-
103
-
104
-
105
-
106
-
107
-
108
-
109
-
110
-
111
-
112
-
113
-
114
-
115
-
116
-
117
-
118
-
119
-
120
-
121
-
122
-
123
-
124
-
125
-
126
-
127
-
128
-
129
-
130
-
131
-
132
-
133
-
134
-
135
-
136
-
137
-
138
-
139
-
140
-
141
-
142
-
143
-
144
-
145
-
146
-
147
-
148
-
149
-
150
-
151
-
152
-
153
-
154
-
155
-
156
-
157
-
158
-
159
-
160
-
161
-
162
-
163
-
164
-
165
-
166
-
167
-
168
-
169
-
170
-
171
-
172
-
173
-
174
-
175
-
176
-
177
-
178
-
179
-
180
-
181
-
182
-
183
-
184
-
185
-
186
-
187
-
188
-
189
-
190
-
191
-
192
-
193
-
194
-
195
-
196
-
197
-
198
-
199
-
200
-
201
-
202
-
203
-
204
-
205
-
206
-
207
-
208
-
209
-
210
 |
 |

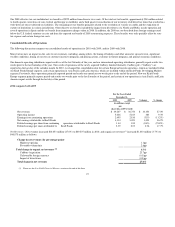
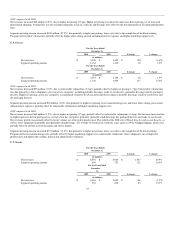
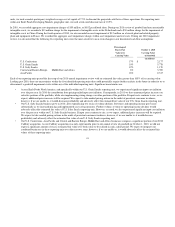
2009 compared with 2008:
Net revenues decreased $225 million (5.4%), due to the significant impact of unfavorable foreign currency (4.5 pp) and unfavorable volume/mix (1.0 pp),
partially offset by higher net pricing (0.1 pp). In Canada, net revenues increased, driven by volume gains across most retail businesses and higher net pricing,
partially offset by unfavorable foreign currency. In N.A. Foodservice, net revenues decreased, driven by lower volume, due to industry-wide declines in
restaurant traffic and the discontinuation of less profitable product lines, lower input cost-driven pricing and unfavorable foreign currency.
Segment operating income increased $67 million (17.0%), due primarily to lower costs due to the completion of the Restructuring Program, lower raw
material costs and higher net pricing, partially offset by unfavorable foreign currency, higher manufacturing costs, unfavorable volume/mix and higher
marketing support costs.
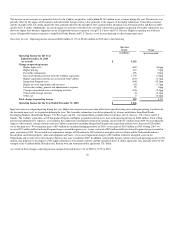
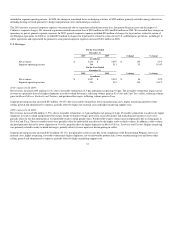
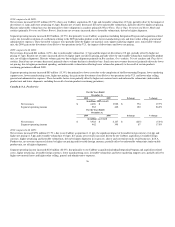
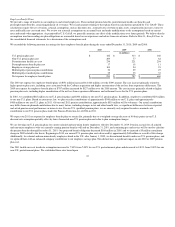
Kraft Foods Europe
For the Years Ended
December 31,
2010 2009 $ change % change
(in millions)
Net revenues $ 11,628 $ 8,768 $ 2,860 32.6%
Segment operating income 1,115 785 330 42.0%
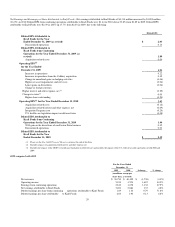
For the Years Ended
December 31,
2009 2008 $ change % change
(in millions)
Net revenues $ 8,768 $ 9,728 $ (960) (9.9%)
Segment operating income 785 182 603 100+%
2010 compared with 2009:
Net revenues increased $2,860 million (32.6%), due to our Cadbury acquisition (33.0 pp) and favorable volume/mix (3.9 pp; including approximately 0.6 pp
from the favorable impact of an accounting calendar change for certain European biscuits operations), partially offset by the impact of unfavorable foreign
currency (3.1 pp), lower net pricing (1.0 pp), and the impact of divestitures (0.2 pp). Volume/mix gains in biscuits, chocolate, cheese and coffee, due primarily
to higher shipments, drove net revenues higher. Lower net pricing was reflected across all categories, except coffee. Unfavorable foreign currency primarily
reflected the strength of the U.S. dollar against the euro, partially offset by the strength of the Swedish krona, Swiss franc, and Norwegian krone versus the
U.S. dollar.
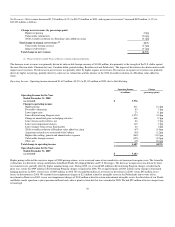
Segment operating income increased $330 million (42.0%), due primarily to favorable volume/mix, lower manufacturing costs, lower other selling, general
and administrative expenses, our Cadbury acquisition (including Integration Program and acquisition-related costs), the 2009 asset impairment charges related
to certain intangible assets in the Netherlands and to write-off an investment in Norway, the 2009 loss on the divestiture of a plant in Spain and lower
marketing support costs. These favorable variances were partially offset by higher raw material costs, lower net pricing, lower reversal of prior years'
Restructuring Program costs, asset impairment charges related to intangible assets in the Netherlands and on a biscuit plant and related property, plant and
equipment in France, and unfavorable foreign currency. The accounting calendar change for certain European biscuits operations had an insignificant impact
on operating income.
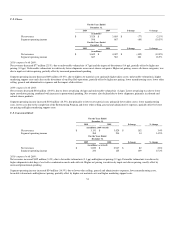
2009 compared with 2008:
Net revenues decreased $960 million (9.9%), due to the significant impact of unfavorable foreign currency (6.7 pp), unfavorable volume/mix (2.8 pp) and the
impact of divestitures (2.2 pp), partially offset by higher net pricing (1.8 pp). Unfavorable foreign currency primarily reflected the strength of the U.S. dollar
versus the euro and pound sterling. In addition, volume declines in coffee, biscuits, chocolate and cheese and the discontinuation of less profitable product
lines drove net revenues lower. These unfavorable revenue drivers were partially offset by higher net pricing, primarily in chocolate, coffee and biscuits.
Segment operating income increased $603 million (100+%), due primarily to lower costs due to the completion of the Restructuring Program (including the
reversal of prior year costs), higher net pricing, the 2008 net loss on the divestitures of several operations in Spain, 2008 asset impairment charges related to
certain international intangible assets and the divestiture of our Nordic and Baltic snacks operation, lower manufacturing costs and lower raw material costs.
These favorable variances were partially offset by unfavorable foreign currency, higher marketing
37