Kraft 2010 Annual Report Download - page 8
Download and view the complete annual report
Please find page 8 of the 2010 Kraft annual report below. You can navigate through the pages in the report by either clicking on the pages listed below, or by using the keyword search tool below to find specific information within the annual report.-
 1
1 -
 2
2 -
 3
3 -
 4
4 -
 5
5 -
 6
6 -
 7
7 -
 8
8 -
 9
9 -
 10
10 -
 11
11 -
 12
12 -
 13
13 -
 14
14 -
 15
15 -
 16
16 -
 17
17 -
 18
18 -
 19
19 -
20
-
21
-
22
-
23
-
24
-
25
-
26
-
27
-
28
-
29
-
30
-
31
-
32
-
33
-
34
-
35
-
36
-
37
-
38
-
39
-
40
-
41
-
42
-
43
-
44
-
45
-
46
-
47
-
48
-
49
-
50
-
51
-
52
-
53
-
54
-
55
-
56
-
57
-
58
-
59
-
60
-
61
-
62
-
63
-
64
-
65
-
66
-
67
-
68
-
69
-
70
-
71
-
72
-
73
-
74
-
75
-
76
-
77
-
78
-
79
-
80
-
81
-
82
-
83
-
84
-
85
-
86
-
87
-
88
-
89
-
90
-
91
-
92
-
93
-
94
-
95
-
96
-
97
-
98
-
99
-
100
-
101
-
102
-
103
-
104
-
105
-
106
-
107
-
108
-
109
-
110
-
111
-
112
-
113
-
114
-
115
-
116
-
117
-
118
-
119
-
120
-
121
-
122
-
123
-
124
-
125
-
126
-
127
-
128
-
129
-
130
-
131
-
132
-
133
-
134
-
135
-
136
-
137
-
138
-
139
-
140
-
141
-
142
-
143
-
144
-
145
-
146
-
147
-
148
-
149
-
150
-
151
-
152
-
153
-
154
-
155
-
156
-
157
-
158
-
159
-
160
-
161
-
162
-
163
-
164
-
165
-
166
-
167
-
168
-
169
-
170
-
171
-
172
-
173
-
174
-
175
-
176
-
177
-
178
-
179
-
180
-
181
-
182
-
183
-
184
-
185
-
186
-
187
-
188
-
189
-
190
-
191
-
192
-
193
-
194
-
195
-
196
-
197
-
198
-
199
-
200
-
201
-
202
-
203
-
204
-
205
-
206
-
207
-
208
-
209
-
210
 |
 |

On February 2, 2010, we acquired 71.73% of Cadbury Shares for $13.1 billion and the value attributed to noncontrolling interests was $5.4 billion. From
February 2, 2010 through June 1, 2010, we acquired the remaining 28.27% of Cadbury Shares for $5.4 billion. We had a $38 million gain on noncontrolling
interest acquired and recorded it within additional paid in capital.
Pizza Divestiture:
On March 1, 2010, we completed the sale of the assets of our North American frozen pizza business ("Frozen Pizza") to Nestlé USA, Inc. ("Nestlé") for $3.7
billion. Our Frozen Pizza business was a component of our U.S. Convenient Meals and Canada & N. A. Foodservice segments. The sale included the
DiGiorno, Tombstone and Jack's brands in the U.S., the Delissio brand in Canada and the California Pizza Kitchen trademark license. It also included two
Wisconsin manufacturing facilities (Medford and Little Chute) and the leases for the pizza depots and delivery trucks. Approximately 3,600 of our employees
transferred with the business to Nestlé. As a result of the divestiture, we recorded a gain on discontinued operations of $1,596 million, or $0.92 per diluted
share, in 2010.
Post Cereals Split-off:
On August 4, 2008, we completed the split-off of the Post cereals business into Ralcorp Holdings, Inc., after an exchange with our shareholders. Accordingly,
the Post cereals business prior period results were reflected as discontinued operations on the consolidated statement of earnings. The exchange was expected
to be tax-free to participating shareholders for U.S. federal income tax purposes.
In this split-off transaction, approximately 46 million shares of Kraft Foods Common Stock were tendered for $1,644 million. Our shareholders had the option
to exchange some or all of their shares of Kraft Foods Common Stock and receive shares of common stock of Cable Holdco, Inc. ("Cable Holdco"). Cable
Holdco was our wholly owned subsidiary that owned certain assets and liabilities of the Post cereals business. In exchange for the contribution of the Post
cereals business, Cable Holdco issued approximately $665 million in debt securities, issued shares of its common stock and assumed a $300 million credit
facility. Upon closing, we used the cash equivalent net proceeds, approximately $960 million, to repay debt. As a result of the split-off, we recorded a gain on
discontinued operations of $926 million, or $0.61 per diluted share, in 2008.
See Note 2, Acquisitions and Divestitures, to our consolidated financial statements for additional information on these transactions.
Customers
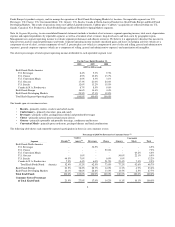
Our five largest customers accounted for approximately 26% of our net revenues in 2010 compared with 27% in 2009 and 2008. Our ten largest customers
accounted for approximately 35% of our net revenues in 2010 compared with 36% in 2009 and 2008. One of our customers, Wal-Mart Stores, Inc., accounted
for approximately 14% of our net revenues in 2010 compared with 16% in 2009 and 2008.
Seasonality
Demand for some of our products may be influenced by holidays, changes in seasons or other annual events. However, overall sales of our products are
generally evenly balanced throughout the year due to the offsetting nature of demands for our diversified product portfolio.
Competition
We face competition in all aspects of our business. Competitors include large national and international companies and numerous local and regional
companies. Some competitors have different profit objectives and some international competitors are less susceptible to currency exchange rates. We also
compete with generic products and retailer brands, wholesalers and cooperatives. We compete primarily on the basis of product quality, brand recognition,
brand loyalty, service, marketing, advertising and price. Moreover, improving our market position or introducing a new product requires substantial
advertising and promotional expenditures.
Distribution and Marketing
Our products are generally sold to supermarket chains, wholesalers, supercenters, club stores, mass merchandisers, distributors, convenience stores, gasoline
stations, drug stores, value stores and other retail food
5