Kraft 2010 Annual Report Download - page 20
Download and view the complete annual report
Please find page 20 of the 2010 Kraft annual report below. You can navigate through the pages in the report by either clicking on the pages listed below, or by using the keyword search tool below to find specific information within the annual report.-
 1
1 -
 2
2 -
 3
3 -
 4
4 -
 5
5 -
 6
6 -
 7
7 -
 8
8 -
 9
9 -
 10
10 -
 11
11 -
 12
12 -
 13
13 -
 14
14 -
 15
15 -
 16
16 -
 17
17 -
 18
18 -
 19
19 -
 20
20 -
 21
21 -
 22
22 -
 23
23 -
 24
24 -
 25
25 -
 26
26 -
 27
27 -
 28
28 -
 29
29 -
 30
30 -
 31
31 -
 32
32 -
 33
33 -
 34
34 -
 35
35 -
 36
36 -
 37
37 -
 38
38 -
 39
39 -
 40
40 -
 41
41 -
 42
42 -
 43
43 -
 44
44 -
 45
45 -
 46
46 -
 47
47 -
 48
48 -
 49
49 -
 50
50 -
 51
51 -
 52
52 -
 53
53 -
 54
54 -
 55
55 -
 56
56 -
 57
57 -
 58
58 -
 59
59 -
 60
60 -
 61
61 -
 62
62 -
 63
63 -
 64
64 -
 65
65 -
 66
66 -
 67
67 -
 68
68 -
 69
69 -
 70
70 -
 71
71 -
 72
72 -
 73
73 -
 74
74 -
 75
75 -
 76
76 -
 77
77 -
 78
78 -
 79
79 -
 80
80 -
 81
81 -
 82
82 -
 83
83 -
 84
84 -
 85
85 -
 86
86 -
 87
87 -
 88
88 -
 89
89 -
 90
90 -
 91
91 -
 92
92 -
 93
93 -
 94
94 -
 95
95 -
 96
96 -
 97
97 -
 98
98 -
 99
99 -
 100
100 -
 101
101 -
 102
102 -
 103
103 -
 104
104 -
 105
105 -
 106
106 -
 107
107 -
 108
108 -
 109
109 -
 110
110 -
 111
111 -
 112
112 -
 113
113 -
 114
114 -
 115
115 -
 116
116 -
 117
117 -
 118
118 -
 119
119 -
 120
120 -
 121
121 -
 122
122 -
 123
123 -
 124
124 -
 125
125 -
 126
126 -
 127
127 -
 128
128 -
 129
129 -
 130
130 -
 131
131 -
 132
132 -
 133
133 -
 134
134 -
 135
135 -
 136
136 -
 137
137 -
 138
138 -
 139
139 -
 140
140 -
 141
141 -
 142
142 -
 143
143 -
 144
144 -
 145
145 -
 146
146 -
 147
147 -
 148
148 -
 149
149 -
 150
150 -
 151
151 -
 152
152 -
 153
153 -
 154
154 -
 155
155 -
 156
156 -
 157
157 -
 158
158 -
 159
159 -
 160
160 -
 161
161 -
 162
162 -
 163
163 -
 164
164 -
 165
165 -
 166
166 -
 167
167 -
 168
168 -
 169
169 -
 170
170 -
 171
171 -
 172
172 -
 173
173 -
 174
174 -
 175
175 -
 176
176 -
 177
177 -
 178
178 -
 179
179 -
 180
180 -
 181
181 -
 182
182 -
 183
183 -
 184
184 -
 185
185 -
 186
186 -
 187
187 -
 188
188 -
 189
189 -
 190
190 -
 191
191 -
 192
192 -
 193
193 -
 194
194 -
 195
195 -
 196
196 -
 197
197 -
 198
198 -
 199
199 -
 200
200 -
 201
201 -
 202
202 -
 203
203 -
 204
204 -
 205
205 -
 206
206 -
 207
207 -
 208
208 -
 209
209 -
 210
210
 |
 |

PART II
Item 5. Market for Registrant's Common Equity, Related Stockholder Matters and Issuer Purchases of Equity Securities.
Our Common Stock is listed on the NYSE. At January 31, 2011, there were approximately 80,245 holders of record of our Common Stock.
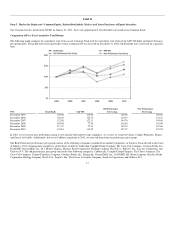
Comparison of Five-Year Cumulative Total Return
The following graph compares the cumulative total return on our Common Stock with the cumulative total return of the S&P 500 Index and the performance
peer group index. The graph shows total shareholder return assuming $100 was invested on December 31, 2004 and dividends were reinvested on a quarterly
basis.
Date Kraft Foods S&P 500
Old Performance
Peer Group
New Performance
Peer Group
December 2005 100.00 100.00 100.00 100.00
December 2006 130.45 115.76 120.15 121.31
December 2007 122.98 122.11 144.70 149.06
December 2008 105.08 77.00 116.84 118.08
December 2009 111.37 97.31 139.19 147.66
December 2010 134.16 111.95 157.37 170.25
In 2010, we revised our peer performance group to only include food and beverage companies. As a result, we removed Clorox, Colgate-Palmolive, Diageo,
and Procter & Gamble. Additionally, due to our Cadbury acquisition in 2010, we removed them from our performance peer group.
The Kraft Foods new performance peer group consists of the following companies considered our market competitors, or that have been selected on the basis
of industry, level of management complexity, global focus or industry leadership: Campbell Soup Company, The Coca-Cola Company, ConAgra Foods, Inc.,
DANONE, General Mills, Inc., H.J. Heinz Company, Hershey Foods Corporation, Kellogg Company, Nestlé S.A., PepsiCo, Inc., Sara Lee Corporation, and
Unilever N.V. The old performance peer group consisted of the following companies: Cadbury plc, Campbell Soup Company, The Clorox Company, The
Coca-Cola Company, Colgate-Palmolive Company, ConAgra Foods, Inc., Diageo plc, General Mills, Inc., DANONE, H.J. Heinz Company, Hershey Foods
Corporation, Kellogg Company, Nestlé S.A., PepsiCo, Inc., The Procter & Gamble Company, Sara Lee Corporation, and Unilever N.V.
17
