Kraft 2010 Annual Report Download - page 72
Download and view the complete annual report
Please find page 72 of the 2010 Kraft annual report below. You can navigate through the pages in the report by either clicking on the pages listed below, or by using the keyword search tool below to find specific information within the annual report.-
 1
1 -
2
-
3
-
4
-
5
-
6
-
7
-
8
-
9
-
10
-
11
-
12
-
13
-
14
-
15
-
16
-
17
-
18
-
19
-
20
-
21
-
22
-
23
-
24
-
25
-
26
-
27
-
28
-
29
-
30
-
31
-
32
-
33
-
34
-
35
-
36
-
37
-
38
-
39
-
40
-
41
-
42
-
43
-
44
-
45
-
46
-
47
-
48
-
49
-
50
-
51
-
52
-
53
-
54
-
55
-
56
-
57
-
58
-
59
-
60
-
61
-
 62
62 -
 63
63 -
 64
64 -
 65
65 -
 66
66 -
 67
67 -
 68
68 -
 69
69 -
 70
70 -
 71
71 -
 72
72 -
 73
73 -
 74
74 -
 75
75 -
 76
76 -
 77
77 -
 78
78 -
 79
79 -
 80
80 -
 81
81 -
 82
82 -
83
-
84
-
85
-
86
-
87
-
88
-
89
-
90
-
91
-
92
-
93
-
94
-
95
-
96
-
97
-
98
-
99
-
100
-
101
-
102
-
103
-
104
-
105
-
106
-
107
-
108
-
109
-
110
-
111
-
112
-
113
-
114
-
115
-
116
-
117
-
118
-
119
-
120
-
121
-
122
-
123
-
124
-
125
-
126
-
127
-
128
-
129
-
130
-
131
-
132
-
133
-
134
-
135
-
136
-
137
-
138
-
139
-
140
-
141
-
142
-
143
-
144
-
145
-
146
-
147
-
148
-
149
-
150
-
151
-
152
-
153
-
154
-
155
-
156
-
157
-
158
-
159
-
160
-
161
-
162
-
163
-
164
-
165
-
166
-
167
-
168
-
169
-
170
-
171
-
172
-
173
-
174
-
175
-
176
-
177
-
178
-
179
-
180
-
181
-
182
-
183
-
184
-
185
-
186
-
187
-
188
-
189
-
190
-
191
-
192
-
193
-
194
-
195
-
196
-
197
-
198
-
199
-
200
-
201
-
202
-
203
-
204
-
205
-
206
-
207
-
208
-
209
-
210
 |
 |

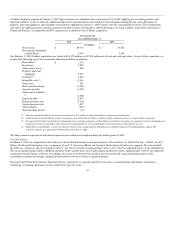
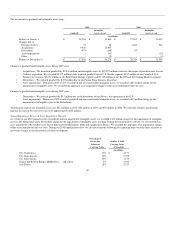
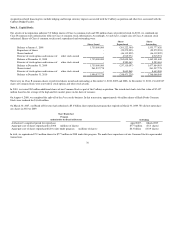
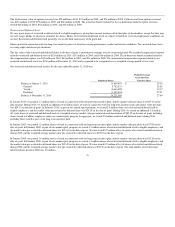
The movements in goodwill and intangible assets were:
2010 2009
Goodwill
Intangible
Assets, at cost Goodwill
Intangible
Assets, at cost
(in millions)
Balance at January 1 $ 28,764 $ 13,540 $ 27,581 $ 13,012
Changes due to:
Foreign currency 37 48 1,200 544
Acquisitions 9,530 12,907 - -
Divestitures (475) (168) (17) -
Asset impairments - (43) - (12)
Other - (5) - (4)
Balance at December 31 $ 37,856 $ 26,279 $ 28,764 $ 13,540
Changes to goodwill and intangible assets during 2010 were:
• Acquisitions - We increased goodwill by $9,530 million and intangible assets by $12,907 million related to allocations of purchase price for our
Cadbury acquisition. We recorded $2,177 million of the acquired goodwill in our U.S. Snacks segment, $937 million in our Canada & N.A.
Foodservice segment, $2,671 million in our Kraft Foods Europe segment and $3,745 million in our Kraft Foods Developing Markets segment.
• Divestitures - We reduced goodwill by $475 million due to our Frozen Pizza business divestiture.
• Asset impairments - During our 2010 review of goodwill and non-amortizable intangible assets, we recorded a $43 million charge for the
impairment of intangible assets. We recorded the aggregate asset impairment charges within asset impairment and exit costs.
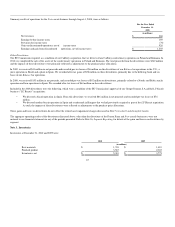
Changes to goodwill and intangible assets during 2009 were:
• Divestitures - We reduced goodwill by $17 million due to the divestiture of our Balance bar operations in the U.S.
• Asset impairments - During our 2009 review of goodwill and non-amortizable intangible assets, we recorded a $12 million charge for the
impairment of intangible assets in the Netherlands.
Amortization expense for intangible assets was $211 million in 2010, $26 million in 2009, and $23 million in 2008. We currently estimate amortization
expense for each of the next five years to be approximately $220 million.
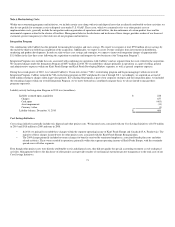
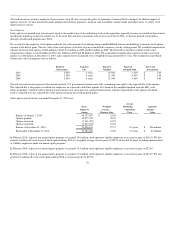
Annual Impairment Review & Asset Impairment Charges:
As a result of our 2010 annual review of goodwill and non-amortizable intangible assets, we recorded a $13 million charge for the impairment of intangible
assets in the Netherlands and a $30 million charge for the impairment of intangible assets in China. During the fourth quarter of 2010, we also recorded an
asset impairment of $12 million on a biscuit plant and related property, plant and equipment in France. We recorded the aggregate asset impairment charges
within asset impairment and exit costs. During our 2010 impairment review, we also noted that the following five reporting units were the most sensitive to
near-term changes in our discounted cash flow assumptions:
Percentage of
Excess Fair
Value over
Carrying Value
October 1, 2010
Carrying Value
of Goodwill
(in millions)
U.S. Confections 17% $ 2,177
U.S. Grain Snacks 10% 5,778
U.S. Salty Snacks 12% 1,170
Central and Eastern Europe, Middle East and Africa 8% 3,390
Asia Pacific 18% 2,517
69