Kraft 2010 Annual Report Download - page 84
Download and view the complete annual report
Please find page 84 of the 2010 Kraft annual report below. You can navigate through the pages in the report by either clicking on the pages listed below, or by using the keyword search tool below to find specific information within the annual report.-
 1
1 -
2
-
3
-
4
-
5
-
6
-
7
-
8
-
9
-
10
-
11
-
12
-
13
-
14
-
15
-
16
-
17
-
18
-
19
-
20
-
21
-
22
-
23
-
24
-
25
-
26
-
27
-
28
-
29
-
30
-
31
-
32
-
33
-
34
-
35
-
36
-
37
-
38
-
39
-
40
-
41
-
42
-
43
-
44
-
45
-
46
-
47
-
48
-
49
-
50
-
51
-
52
-
53
-
54
-
55
-
56
-
57
-
58
-
59
-
60
-
61
-
62
-
63
-
64
-
65
-
66
-
67
-
68
-
69
-
70
-
71
-
72
-
73
-
 74
74 -
 75
75 -
 76
76 -
 77
77 -
 78
78 -
 79
79 -
 80
80 -
 81
81 -
 82
82 -
 83
83 -
 84
84 -
 85
85 -
 86
86 -
 87
87 -
 88
88 -
 89
89 -
 90
90 -
 91
91 -
 92
92 -
 93
93 -
 94
94 -
95
-
96
-
97
-
98
-
99
-
100
-
101
-
102
-
103
-
104
-
105
-
106
-
107
-
108
-
109
-
110
-
111
-
112
-
113
-
114
-
115
-
116
-
117
-
118
-
119
-
120
-
121
-
122
-
123
-
124
-
125
-
126
-
127
-
128
-
129
-
130
-
131
-
132
-
133
-
134
-
135
-
136
-
137
-
138
-
139
-
140
-
141
-
142
-
143
-
144
-
145
-
146
-
147
-
148
-
149
-
150
-
151
-
152
-
153
-
154
-
155
-
156
-
157
-
158
-
159
-
160
-
161
-
162
-
163
-
164
-
165
-
166
-
167
-
168
-
169
-
170
-
171
-
172
-
173
-
174
-
175
-
176
-
177
-
178
-
179
-
180
-
181
-
182
-
183
-
184
-
185
-
186
-
187
-
188
-
189
-
190
-
191
-
192
-
193
-
194
-
195
-
196
-
197
-
198
-
199
-
200
-
201
-
202
-
203
-
204
-
205
-
206
-
207
-
208
-
209
-
210
 |
 |

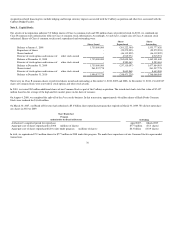
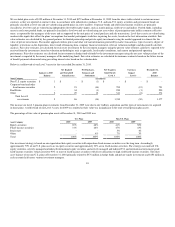
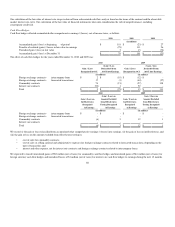
Certain of our U.S. and non-U.S. plans are underfunded and have accumulated benefit obligations in excess of plan assets. For these plans, the projected
benefit obligations, accumulated benefit obligations and the fair value of plan assets at December 31, 2010 and 2009 were:
U.S. Plans Non-U.S. Plans
2010 2009 2010 2009
(in millions)
Projected benefit obligation $ 5,097 $ 4,666 $ 7,934 $ 3,703
Accumulated benefit obligation 4,627 4,166 7,668 3,478
Fair value of plan assets 4,156 3,932 6,471 2,629
We used the following weighted-average assumptions to determine our benefit obligations under the pension plans at December 31:
U.S. Plans Non-U.S. Plans
2010 2009 2010 2009
Discount rate 5.53% 5.93% 5.11% 5.21%
Expected rate of return on plan assets 7.95% 8.00% 6.77% 7.26%
Rate of compensation increase 4.00% 4.00% 3.68% 3.08%
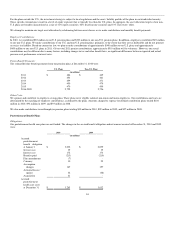
Year-end discount rates for our U.S. and Canadian plans were developed from a model portfolio of high quality, fixed-income debt instruments with durations
that match the expected future cash flows of the benefit obligations. Year-end discount rates for our non-U.S. plans (other than Canadian plans) were
developed from local bond indices that match local benefit obligations as closely as possible. Changes in our discount rates were primarily the result of
changes in bond yields year-over-year. We determine our expected rate of return on plan assets from the plan assets' historical long-term investment
performance, current asset allocation and estimates of future long-term returns by asset class.
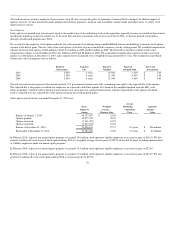
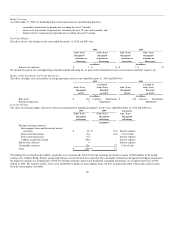
Components of Net Pension Cost:
Net pension cost consisted of the following for the years ended December 31, 2010, 2009, and 2008:
U.S. Plans Non-U.S. Plans
2010 2009 2008 2010 2009 2008
(in millions)
Service cost $ 145 $ 152 $ 149 $ 162 $ 67 $ 91
Interest cost 368 369 371 419 215 222
Expected return on plan assets (490) (486) (526) (467) (242) (285)
Amortization:
Net loss from experience differences 170 160 85 77 23 31
Prior service cost 6 6 7 7 6 7
Other expenses 123 112 74 11 8 16
Net pension cost $ 322 $ 313 $ 160 $ 209 $ 77 $ 82
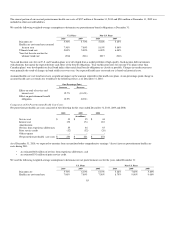
A significant portion of the 2010 increase in non-U.S. net periodic pension cost related to the Cadbury acquisition. The following costs are included within
other expenses above. Severance payments related to our Cost Savings Initiatives and Restructuring Program, and retired employees who elected lump-sum
payments resulted in settlement losses for our U.S. plans of $118 million in 2010, $107 million in 2009, and $74 million in 2008. In addition, we incurred a $5
million curtailment charge in 2010 related to the divestiture of our Frozen Pizza business. Non-U.S. plant closures and early retirement benefits resulted in
curtailment and settlement losses of $11 million in 2010, $8 million in 2009, and $16 million in 2008.
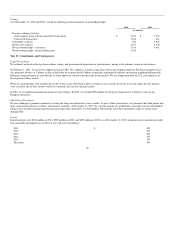
For the U.S. plans, we determine the expected return on plan assets component of net periodic benefit cost using a calculated market return value that
recognizes the cost over a four year period. For our non-U.S. plans, we utilize a similar approach with varying cost recognition periods for some plans, and
with others, we determine the expected return on plan assets based on asset fair values as of the measurement date.
81