Kraft 2010 Annual Report Download - page 101
Download and view the complete annual report
Please find page 101 of the 2010 Kraft annual report below. You can navigate through the pages in the report by either clicking on the pages listed below, or by using the keyword search tool below to find specific information within the annual report.-
 1
1 -
2
-
3
-
4
-
5
-
6
-
7
-
8
-
9
-
10
-
11
-
12
-
13
-
14
-
15
-
16
-
17
-
18
-
19
-
20
-
21
-
22
-
23
-
24
-
25
-
26
-
27
-
28
-
29
-
30
-
31
-
32
-
33
-
34
-
35
-
36
-
37
-
38
-
39
-
40
-
41
-
42
-
43
-
44
-
45
-
46
-
47
-
48
-
49
-
50
-
51
-
52
-
53
-
54
-
55
-
56
-
57
-
58
-
59
-
60
-
61
-
62
-
63
-
64
-
65
-
66
-
67
-
68
-
69
-
70
-
71
-
72
-
73
-
74
-
75
-
76
-
77
-
78
-
79
-
80
-
81
-
82
-
83
-
84
-
85
-
86
-
87
-
88
-
89
-
90
-
 91
91 -
 92
92 -
 93
93 -
 94
94 -
 95
95 -
 96
96 -
 97
97 -
 98
98 -
 99
99 -
 100
100 -
 101
101 -
 102
102 -
 103
103 -
 104
104 -
 105
105 -
 106
106 -
 107
107 -
 108
108 -
 109
109 -
 110
110 -
 111
111 -
112
-
113
-
114
-
115
-
116
-
117
-
118
-
119
-
120
-
121
-
122
-
123
-
124
-
125
-
126
-
127
-
128
-
129
-
130
-
131
-
132
-
133
-
134
-
135
-
136
-
137
-
138
-
139
-
140
-
141
-
142
-
143
-
144
-
145
-
146
-
147
-
148
-
149
-
150
-
151
-
152
-
153
-
154
-
155
-
156
-
157
-
158
-
159
-
160
-
161
-
162
-
163
-
164
-
165
-
166
-
167
-
168
-
169
-
170
-
171
-
172
-
173
-
174
-
175
-
176
-
177
-
178
-
179
-
180
-
181
-
182
-
183
-
184
-
185
-
186
-
187
-
188
-
189
-
190
-
191
-
192
-
193
-
194
-
195
-
196
-
197
-
198
-
199
-
200
-
201
-
202
-
203
-
204
-
205
-
206
-
207
-
208
-
209
-
210
 |
 |

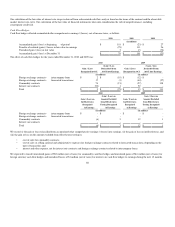
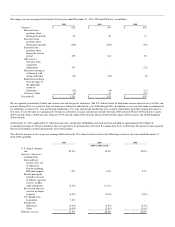
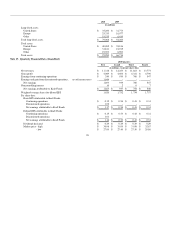
Total assets, depreciation expense and capital expenditures by segment were:
2010 2009
(in millions)
Total assets:
Kraft Foods North America:
U.S. Beverages $ 2,513 $ 2,382
U.S. Cheese 4,633 4,589
U.S. Convenient Meals 2,064 3,063
U.S. Grocery 5,574 5,565
U.S. Snacks 20,895 16,418
Canada & N.A. Foodservice 7,207 5,051
Kraft Foods Europe 24,261 16,073
Kraft Foods Developing Markets 25,738 11,087
Unallocated assets (1) 2,404 2,486
Total assets $ 95,289 $ 66,714
(1) Unallocated assets consist primarily of cash and cash equivalents, deferred income taxes, centrally held property, plant and
equipment, prepaid pension assets and derivative financial instrument balances.
For the Years Ended December 31,
2010 2009 2008
(in millions; 2009 & 2008 revised)
Depreciation expense:
Kraft Foods North America:
U.S. Beverages $ 73 $ 69 $ 68
U.S. Cheese 67 66 66
U.S. Convenient Meals 61 67 62
U.S. Grocery 88 82 78
U.S. Snacks 139 127 129
Canada & N.A. Foodservice 110 83 93
Kraft Foods Europe 355 237 265
Kraft Foods Developing Markets 320 157 160
Total - continuing operations 1,213 888 921
Discontinued operations 16 17 42
Total depreciation expense $ 1,229 $ 905 $ 963
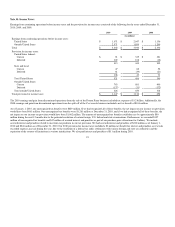
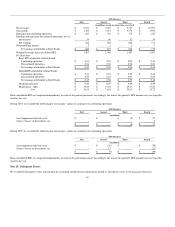
For the Years Ended December 31,
2010 2009 2008
(in millions)
Capital expenditures:
Kraft Foods North America:
U.S. Beverages $ 88 $ 82 $ 110
U.S. Cheese 88 72 97
U.S. Convenient Meals 109 135 143
U.S. Grocery 76 85 87
U.S. Snacks 245 190 122
Canada & N.A. Foodservice 112 94 98
Kraft Foods Europe 334 292 285
Kraft Foods Developing Markets 607 319 368
Total - continuing operations 1,659 1,269 1,310
Discontinued operations 2 61 57
Total capital expenditures $ 1,661 $ 1,330 $ 1,367
96