Kraft 2010 Annual Report Download - page 38
Download and view the complete annual report
Please find page 38 of the 2010 Kraft annual report below. You can navigate through the pages in the report by either clicking on the pages listed below, or by using the keyword search tool below to find specific information within the annual report.-
 1
1 -
2
-
3
-
4
-
5
-
6
-
7
-
8
-
9
-
10
-
11
-
12
-
13
-
14
-
15
-
16
-
17
-
18
-
19
-
20
-
21
-
22
-
23
-
24
-
25
-
26
-
27
-
 28
28 -
 29
29 -
 30
30 -
 31
31 -
 32
32 -
 33
33 -
 34
34 -
 35
35 -
 36
36 -
 37
37 -
 38
38 -
 39
39 -
 40
40 -
 41
41 -
 42
42 -
 43
43 -
 44
44 -
 45
45 -
 46
46 -
 47
47 -
 48
48 -
49
-
50
-
51
-
52
-
53
-
54
-
55
-
56
-
57
-
58
-
59
-
60
-
61
-
62
-
63
-
64
-
65
-
66
-
67
-
68
-
69
-
70
-
71
-
72
-
73
-
74
-
75
-
76
-
77
-
78
-
79
-
80
-
81
-
82
-
83
-
84
-
85
-
86
-
87
-
88
-
89
-
90
-
91
-
92
-
93
-
94
-
95
-
96
-
97
-
98
-
99
-
100
-
101
-
102
-
103
-
104
-
105
-
106
-
107
-
108
-
109
-
110
-
111
-
112
-
113
-
114
-
115
-
116
-
117
-
118
-
119
-
120
-
121
-
122
-
123
-
124
-
125
-
126
-
127
-
128
-
129
-
130
-
131
-
132
-
133
-
134
-
135
-
136
-
137
-
138
-
139
-
140
-
141
-
142
-
143
-
144
-
145
-
146
-
147
-
148
-
149
-
150
-
151
-
152
-
153
-
154
-
155
-
156
-
157
-
158
-
159
-
160
-
161
-
162
-
163
-
164
-
165
-
166
-
167
-
168
-
169
-
170
-
171
-
172
-
173
-
174
-
175
-
176
-
177
-
178
-
179
-
180
-
181
-
182
-
183
-
184
-
185
-
186
-
187
-
188
-
189
-
190
-
191
-
192
-
193
-
194
-
195
-
196
-
197
-
198
-
199
-
200
-
201
-
202
-
203
-
204
-
205
-
206
-
207
-
208
-
209
-
210
 |
 |

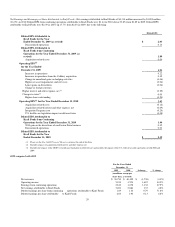
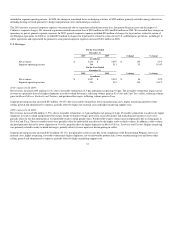
2009 compared with 2008:
Net revenues increased $82 million (2.8%), due to higher net pricing (2.8 pp). Higher net pricing was driven by input cost-driven pricing, net of increased
promotional spending. Volume/mix was flat as higher shipments in bacon, cold cuts and hot dogs were offset by the discontinuation of less profitable product
lines.
Segment operating income increased $109 million (87.2%), due primarily to higher net pricing, lower costs due to the completion of the Restructuring
Program and favorable volume/mix, partially offset by higher other selling, general and administrative expenses and higher marketing support costs.
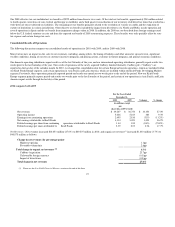
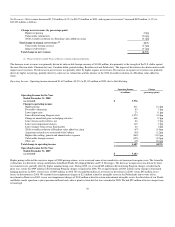
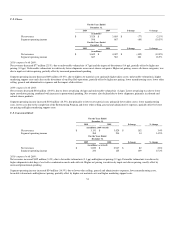
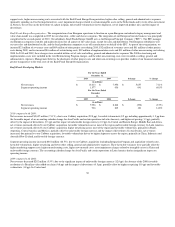
U.S. Grocery
For the Years Ended
December 31,
2010 2009 $ change % change
(in millions)
Net revenues $ 3,398 $ 3,453 $ (55) (1.6%)
Segment operating income 1,164 1,146 18 1.6%
For the Years Ended
December 31,
2009 2008 $ change % change
(in millions)
Net revenues $ 3,453 $ 3,389 $ 64 1.9%
Segment operating income 1,146 1,009 137 13.6%
2010 compared with 2009:
Net revenues decreased $55 million (1.6%), due to unfavorable volume/mix (3.3 pp), partially offset by higher net pricing (1.7 pp). Unfavorable volume/mix
was due primarily to lower shipments across most key categories, including pourable dressings, ready-to-eat desserts, spoonable dressings and dry packaged
desserts. Higher net pricing, across key categories, was primarily related to Kraft macaroni and cheese dinners, pourable dressings, ready-to-eat desserts and
dry packaged desserts.
Segment operating income increased $18 million (1.6%), due primarily to higher net pricing, lower manufacturing costs and lower other selling, general and
administrative expenses, partially offset by unfavorable volume/mix and higher marketing support costs.
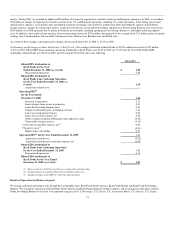
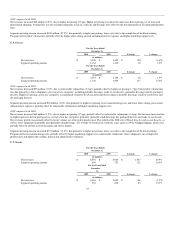
2009 compared with 2008:
Net revenues increased $64 million (1.9%), due to higher net pricing (3.5 pp), partially offset by unfavorable volume/mix (1.6 pp). Net revenues increased due
to higher input cost-driven pricing across several of our key categories, primarily spoonable salad dressings, dry packaged desserts and ready-to-eat desserts.
Net revenues growth was partially offset by lower volume, net of favorable product mix. This reflected the 2008 exit of Handi-Snacks ready-to-eat desserts, as
well as lower shipments in pourable and spoonable salad dressings, Jell-O ready-to-eat-desserts, barbecue sauce and Cool Whip whipped topping, which were
partially offset by growth in Kraft macaroni and cheese dinners.
Segment operating income increased $137 million (13.6%), due primarily to higher net pricing, lower costs due to the completion of the Restructuring
Program and lower manufacturing costs, partially offset by higher marketing support costs, unfavorable volume/mix (lower shipments, net of improved
product mix) and higher other selling, general and administrative expenses.
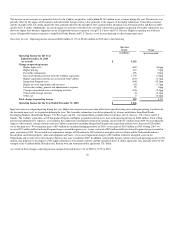
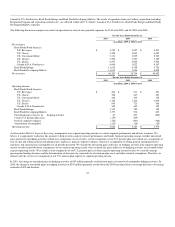
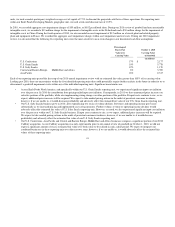
U.S. Snacks
For the Years Ended
December 31,
2010 2009 $ change % change
(in millions)
Net revenues $ 6,001 $ 4,964 $ 1,037 20.9%
Segment operating income 845 723 122 16.9%
For the Years Ended
December
31,
2009 2008 $ change % change
(in millions)
Net revenues $ 4,964 $ 5,025 $ (61) (1.2%)
Segment operating income 723 638 85 13.3%
35