Kraft 2010 Annual Report Download - page 104
Download and view the complete annual report
Please find page 104 of the 2010 Kraft annual report below. You can navigate through the pages in the report by either clicking on the pages listed below, or by using the keyword search tool below to find specific information within the annual report.-
 1
1 -
2
-
3
-
4
-
5
-
6
-
7
-
8
-
9
-
10
-
11
-
12
-
13
-
14
-
15
-
16
-
17
-
18
-
19
-
20
-
21
-
22
-
23
-
24
-
25
-
26
-
27
-
28
-
29
-
30
-
31
-
32
-
33
-
34
-
35
-
36
-
37
-
38
-
39
-
40
-
41
-
42
-
43
-
44
-
45
-
46
-
47
-
48
-
49
-
50
-
51
-
52
-
53
-
54
-
55
-
56
-
57
-
58
-
59
-
60
-
61
-
62
-
63
-
64
-
65
-
66
-
67
-
68
-
69
-
70
-
71
-
72
-
73
-
74
-
75
-
76
-
77
-
78
-
79
-
80
-
81
-
82
-
83
-
84
-
85
-
86
-
87
-
88
-
89
-
90
-
91
-
92
-
93
-
 94
94 -
 95
95 -
 96
96 -
 97
97 -
 98
98 -
 99
99 -
 100
100 -
 101
101 -
 102
102 -
 103
103 -
 104
104 -
 105
105 -
 106
106 -
 107
107 -
 108
108 -
 109
109 -
 110
110 -
 111
111 -
 112
112 -
 113
113 -
 114
114 -
115
-
116
-
117
-
118
-
119
-
120
-
121
-
122
-
123
-
124
-
125
-
126
-
127
-
128
-
129
-
130
-
131
-
132
-
133
-
134
-
135
-
136
-
137
-
138
-
139
-
140
-
141
-
142
-
143
-
144
-
145
-
146
-
147
-
148
-
149
-
150
-
151
-
152
-
153
-
154
-
155
-
156
-
157
-
158
-
159
-
160
-
161
-
162
-
163
-
164
-
165
-
166
-
167
-
168
-
169
-
170
-
171
-
172
-
173
-
174
-
175
-
176
-
177
-
178
-
179
-
180
-
181
-
182
-
183
-
184
-
185
-
186
-
187
-
188
-
189
-
190
-
191
-
192
-
193
-
194
-
195
-
196
-
197
-
198
-
199
-
200
-
201
-
202
-
203
-
204
-
205
-
206
-
207
-
208
-
209
-
210
 |
 |

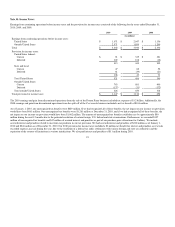
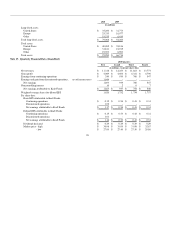
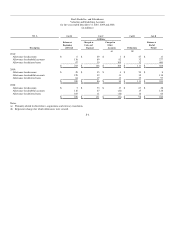
2009 Quarters
First Second Third Fourth
(in millions, except per share data; as revised)
Net revenues $ 8,979 $ 9,781 $ 9,397 $ 10,597
Gross profit $ 3,100 $ 3,512 $ 3,378 $ 3,945
Earnings from continuing operations $ 603 $ 781 $ 774 $ 652
Earnings and gain from discontinued operations, net of
income taxes 59 48 52 59
Net earnings 662 829 826 711
Noncontrolling interest 2 2 2 1
Net earnings attributable to Kraft Foods $ 660 $ 827 $ 824 $ 710
Weighted-average shares for diluted EPS 1,483 1,484 1,487 1,487
Per share data:
Basic EPS attributable to Kraft Foods:
Continuing operations $ 0.41 $ 0.53 $ 0.52 $ 0.44
Discontinued operations 0.04 0.03 0.04 0.04
Net earnings attributable to Kraft Foods $ 0.45 $ 0.56 $ 0.56 $ 0.48
Diluted EPS attributable to Kraft Foods:
Continuing operations $ 0.41 $ 0.53 $ 0.52 $ 0.44
Discontinued operations 0.04 0.03 0.03 0.04
Net earnings attributable to Kraft Foods $ 0.45 $ 0.56 $ 0.55 $ 0.48
Dividends declared $ 0.29 $ 0.29 $ 0.29 $ 0.29
Market price - high $ 29.84 $ 27.24 $ 29.11 $ 27.84
- low $ 20.81 $ 21.94 $ 25.41 $ 25.72
Basic and diluted EPS are computed independently for each of the periods presented. Accordingly, the sum of the quarterly EPS amounts may not equal the
total for the year.
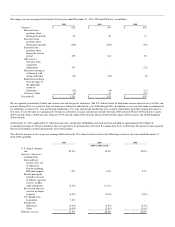
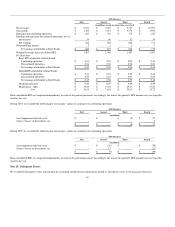
During 2010, we recorded the following pre-tax charges / (gains) in earnings from continuing operations:
2010 Quarters
First Second Third Fourth
(in millions)
Asset impairment and exit costs $ - $ - $ (9) $ 27
(Gains) / losses on divestitures, net - - - 6
$ - $ - $ (9) $ 33
During 2009, we recorded the following pre-tax charges / (gains) in earnings from continuing operations:
2009 Quarters
First Second Third Fourth
(in millions)
Asset impairment and exit costs $ - $ (26) $ - $ (38)
(Gains) / losses on divestitures, net - 17 - (11)
$ - $ (9) $ - $ (49)
Basic and diluted EPS are computed independently for each of the periods presented. Accordingly, the sum of the quarterly EPS amounts may not equal the
total for the year.
Note 18. Subsequent Events:
We evaluated subsequent events and included all accounting and disclosure requirements related to subsequent events in our financial statements.
99