Kraft 2010 Annual Report Download - page 22
Download and view the complete annual report
Please find page 22 of the 2010 Kraft annual report below. You can navigate through the pages in the report by either clicking on the pages listed below, or by using the keyword search tool below to find specific information within the annual report.-
 1
1 -
2
-
3
-
4
-
5
-
6
-
7
-
8
-
9
-
10
-
11
-
 12
12 -
 13
13 -
 14
14 -
 15
15 -
 16
16 -
 17
17 -
 18
18 -
 19
19 -
 20
20 -
 21
21 -
 22
22 -
 23
23 -
 24
24 -
 25
25 -
 26
26 -
 27
27 -
 28
28 -
 29
29 -
 30
30 -
 31
31 -
 32
32 -
33
-
34
-
35
-
36
-
37
-
38
-
39
-
40
-
41
-
42
-
43
-
44
-
45
-
46
-
47
-
48
-
49
-
50
-
51
-
52
-
53
-
54
-
55
-
56
-
57
-
58
-
59
-
60
-
61
-
62
-
63
-
64
-
65
-
66
-
67
-
68
-
69
-
70
-
71
-
72
-
73
-
74
-
75
-
76
-
77
-
78
-
79
-
80
-
81
-
82
-
83
-
84
-
85
-
86
-
87
-
88
-
89
-
90
-
91
-
92
-
93
-
94
-
95
-
96
-
97
-
98
-
99
-
100
-
101
-
102
-
103
-
104
-
105
-
106
-
107
-
108
-
109
-
110
-
111
-
112
-
113
-
114
-
115
-
116
-
117
-
118
-
119
-
120
-
121
-
122
-
123
-
124
-
125
-
126
-
127
-
128
-
129
-
130
-
131
-
132
-
133
-
134
-
135
-
136
-
137
-
138
-
139
-
140
-
141
-
142
-
143
-
144
-
145
-
146
-
147
-
148
-
149
-
150
-
151
-
152
-
153
-
154
-
155
-
156
-
157
-
158
-
159
-
160
-
161
-
162
-
163
-
164
-
165
-
166
-
167
-
168
-
169
-
170
-
171
-
172
-
173
-
174
-
175
-
176
-
177
-
178
-
179
-
180
-
181
-
182
-
183
-
184
-
185
-
186
-
187
-
188
-
189
-
190
-
191
-
192
-
193
-
194
-
195
-
196
-
197
-
198
-
199
-
200
-
201
-
202
-
203
-
204
-
205
-
206
-
207
-
208
-
209
-
210
 |
 |

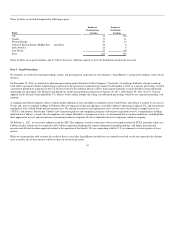
Item 6. Selected Financial Data.
Kraft Foods Inc.
Selected Financial Data—Five Year Review
(in millions of dollars, except per share and employee data)
2010 2009 2008 2007 2006
Summary of Operations:
Net revenues $ 49,207 $ 38,754 $ 40,492 $ 34,580 $ 31,849
Cost of sales 31,305 24,819 27,164 22,848 20,573
Operating income 5,666 5,183 3,576 3,939 3,935
Operating margin 11.5% 13.4% 8.8% 11.4% 12.4%
Interest and other expense, net 2,024 1,237 1,240 604 510
Earnings from continuing operations before income taxes 3,642 3,946 2,336 3,335 3,425
Provision for income taxes 1,147 1,136 658 992 732
Earnings and gain from discontinued operations, net of income taxes 1,644 218 1,215 381 372
Net earnings 4,139 3,028 2,893 2,724 3,065
Noncontrolling interest 25 7 9 3 5
Net earnings attributable to Kraft Foods 4,114 3,021 2,884 2,721 3,060
Basic EPS attributable to Kraft Foods:
Continuing operations 1.44 1.90 1.11 1.47 1.62
Discontinued operations 0.96 0.14 0.81 0.24 0.22
Net earnings attributable to Kraft Foods 2.40 2.04 1.92 1.71 1.84
Diluted EPS attributable to Kraft Foods:
Continuing operations 1.44 1.89 1.10 1.46 1.62
Discontinued operations 0.95 0.14 0.80 0.24 0.22
Net earnings attributable to Kraft Foods 2.39 2.03 1.90 1.70 1.84
Dividends declared per share 1.16 1.16 1.12 1.04 0.96
Dividends declared as a % of basic EPS 48.3% 56.9% 58.3% 60.8% 52.2%
Dividends declared as a % of diluted EPS 48.5% 57.1% 58.9% 61.2% 52.2%
Weighted-average shares - basic 1,715 1,478 1,505 1,591 1,659
Weighted-average shares - diluted 1,720 1,486 1,515 1,600 1,661
Net cash provided by operating activities 3,748 5,084 4,141 3,571 3,720
Capital expenditures 1,661 1,330 1,367 1,241 1,169
Free cash flow* 2,087 3,754 2,774 2,330 2,551
Depreciation 1,229 905 963 873 884
Property, plant and equipment, net 13,792 10,693 9,917 10,778 9,693
Inventories, net 5,310 3,775 3,881 4,238 3,436
Total assets 95,289 66,714 63,173 68,132 55,548
Long-term debt 26,859 18,024 18,589 12,902 7,081
Total debt 28,724 18,990 20,251 21,009 10,821
Total long-term liabilities 43,687 29,251 29,773 23,574 16,520
Total Kraft Foods shareholders' equity 35,834 25,876 22,295 27,407 28,536
Total equity 35,942 25,972 22,356 27,445 28,562
Book value per common share outstanding 20.50 17.51 15.18 17.87 17.44
Market price per Common Stock share - high / low 32.67-27.09 29.84-20.81 34.97-24.75 37.20-29.95 36.67-27.44
Closing price of Common Stock at year end 31.51 27.18 26.85 32.63 35.70
Price / earnings ratio at year end - basic 13 13 14 19 19
Price / earnings ratio at year end - diluted 13 13 14 19 19
Shares outstanding at year end 1,748 1,478 1,469 1,534 1,636
Number of employees 127,000 97,000 98,000 103,000 90,000
* Please see Non-GAAP Financial Measures section at the end of Item 7.
19