Kraft 2010 Annual Report Download - page 44
Download and view the complete annual report
Please find page 44 of the 2010 Kraft annual report below. You can navigate through the pages in the report by either clicking on the pages listed below, or by using the keyword search tool below to find specific information within the annual report.-
 1
1 -
2
-
3
-
4
-
5
-
6
-
7
-
8
-
9
-
10
-
11
-
12
-
13
-
14
-
15
-
16
-
17
-
18
-
19
-
20
-
21
-
22
-
23
-
24
-
25
-
26
-
27
-
28
-
29
-
30
-
31
-
32
-
33
-
 34
34 -
 35
35 -
 36
36 -
 37
37 -
 38
38 -
 39
39 -
 40
40 -
 41
41 -
 42
42 -
 43
43 -
 44
44 -
 45
45 -
 46
46 -
 47
47 -
 48
48 -
 49
49 -
 50
50 -
 51
51 -
 52
52 -
 53
53 -
 54
54 -
55
-
56
-
57
-
58
-
59
-
60
-
61
-
62
-
63
-
64
-
65
-
66
-
67
-
68
-
69
-
70
-
71
-
72
-
73
-
74
-
75
-
76
-
77
-
78
-
79
-
80
-
81
-
82
-
83
-
84
-
85
-
86
-
87
-
88
-
89
-
90
-
91
-
92
-
93
-
94
-
95
-
96
-
97
-
98
-
99
-
100
-
101
-
102
-
103
-
104
-
105
-
106
-
107
-
108
-
109
-
110
-
111
-
112
-
113
-
114
-
115
-
116
-
117
-
118
-
119
-
120
-
121
-
122
-
123
-
124
-
125
-
126
-
127
-
128
-
129
-
130
-
131
-
132
-
133
-
134
-
135
-
136
-
137
-
138
-
139
-
140
-
141
-
142
-
143
-
144
-
145
-
146
-
147
-
148
-
149
-
150
-
151
-
152
-
153
-
154
-
155
-
156
-
157
-
158
-
159
-
160
-
161
-
162
-
163
-
164
-
165
-
166
-
167
-
168
-
169
-
170
-
171
-
172
-
173
-
174
-
175
-
176
-
177
-
178
-
179
-
180
-
181
-
182
-
183
-
184
-
185
-
186
-
187
-
188
-
189
-
190
-
191
-
192
-
193
-
194
-
195
-
196
-
197
-
198
-
199
-
200
-
201
-
202
-
203
-
204
-
205
-
206
-
207
-
208
-
209
-
210
 |
 |

units, we used a market-participant, weighted-average cost of capital of 7.5% to discount the projected cash flows of those operations. For reporting units
within our Kraft Foods Developing Markets geographic unit, we used a risk-rated discount rate of 10.5%.
In 2010, we recorded aggregate asset impairment charges of $55 million, or $0.02 per diluted share. During our 2010 review of goodwill and non-amortizable
intangible assets, we recorded a $13 million charge for the impairment of intangible assets in the Netherlands and a $30 million charge for the impairment of
intangible assets in China. During the fourth quarter of 2010, we also recorded an asset impairment of $12 million on a biscuit plant and related property,
plant and equipment in France. We recorded the aggregate asset impairment charges within asset impairment and exit costs. During our 2010 impairment
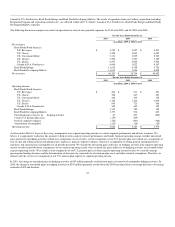
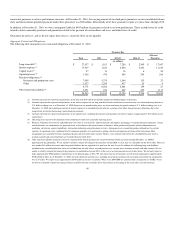
review, we also noted that the following five reporting units were the most sensitive to near-term changes in our discounted cash flow assumptions:
Percentage of
Excess Fair
Value over
Carrying Value
October 1, 2010
Carrying Value
of Goodwill
(in millions)
U.S. Confections 17% $ 2,177
U.S. Grain Snacks 10% 5,778
U.S. Salty Snacks 12% 1,170
Central and Eastern Europe, Middle East and Africa 8% 3,390
Asia Pacific 18% 2,517
Each of our reporting units passed the first step of our 2010 annual impairment review with an estimated fair value greater than 105% of its carrying value.
Looking past 2010, there are uncertainties within the five identified reporting units that could potentially require further analysis in the future in order for us to
determine if a goodwill impairment exists within any of the individual reporting units. Significant uncertainties are:
• Across Kraft Foods North America, and specifically within our U.S. Grain Snacks reporting unit, we experienced significant input cost inflation
over the past year. In 2010 the contribution from pricing trailed input cost inflation. Consequently, in 2011 we have announced price increases on
selective portions of the portfolio, while also implementing sizing changes on other portions of the portfolio. If input costs continue to rise, as we
expect, additional price increases will be required. We expect to take needed pricing actions in the midst of persistent consumer weakness;
however, if we are unable to, it would decrease profitability and adversely affect the estimated fair value of our U.S. Grain Snacks reporting unit.
• Our U.S. Salty Snacks business grew in 2010, after experiencing two years of volume declines. Revenues and operating income grew more
substantially as we increased pricing and implemented cost saving measures. Further volume, revenue or operating income declines would
adversely affect the estimated fair value of U.S. Salty Snacks reporting unit. However, as noted, we also experienced significant input cost inflation
over the past year within our U.S. Salty Snacks business. If input costs continue to rise, as we expect, additional price increases will be required.
We expect to take needed pricing actions in the midst of persistent consumer weakness; however, if we are unable to, it would decrease
profitability and adversely affect the estimated fair value of our U.S. Salty Snacks reporting unit.
• Our U.S. Confections, Asia Pacific and Central and Eastern Europe, Middle East and Africa businesses compose a significant portion of our 2010
Cadbury acquisition. As our Cadbury acquisition was only eight months prior to our annual review of goodwill on October 1, 2010, we did not
expect a significant amount of excess estimated fair value over book value to be realized in such a short period. We expect to integrate our
combined businesses in these reporting units over the next two years; however, if we are unable to, it would adversely affect the estimated fair
values of these reporting units.
41