Kraft 2010 Annual Report Download - page 27
Download and view the complete annual report
Please find page 27 of the 2010 Kraft annual report below. You can navigate through the pages in the report by either clicking on the pages listed below, or by using the keyword search tool below to find specific information within the annual report.-
 1
1 -
2
-
3
-
4
-
5
-
6
-
7
-
8
-
9
-
10
-
11
-
12
-
13
-
14
-
15
-
16
-
 17
17 -
 18
18 -
 19
19 -
 20
20 -
 21
21 -
 22
22 -
 23
23 -
 24
24 -
 25
25 -
 26
26 -
 27
27 -
 28
28 -
 29
29 -
 30
30 -
 31
31 -
 32
32 -
 33
33 -
 34
34 -
 35
35 -
 36
36 -
 37
37 -
38
-
39
-
40
-
41
-
42
-
43
-
44
-
45
-
46
-
47
-
48
-
49
-
50
-
51
-
52
-
53
-
54
-
55
-
56
-
57
-
58
-
59
-
60
-
61
-
62
-
63
-
64
-
65
-
66
-
67
-
68
-
69
-
70
-
71
-
72
-
73
-
74
-
75
-
76
-
77
-
78
-
79
-
80
-
81
-
82
-
83
-
84
-
85
-
86
-
87
-
88
-
89
-
90
-
91
-
92
-
93
-
94
-
95
-
96
-
97
-
98
-
99
-
100
-
101
-
102
-
103
-
104
-
105
-
106
-
107
-
108
-
109
-
110
-
111
-
112
-
113
-
114
-
115
-
116
-
117
-
118
-
119
-
120
-
121
-
122
-
123
-
124
-
125
-
126
-
127
-
128
-
129
-
130
-
131
-
132
-
133
-
134
-
135
-
136
-
137
-
138
-
139
-
140
-
141
-
142
-
143
-
144
-
145
-
146
-
147
-
148
-
149
-
150
-
151
-
152
-
153
-
154
-
155
-
156
-
157
-
158
-
159
-
160
-
161
-
162
-
163
-
164
-
165
-
166
-
167
-
168
-
169
-
170
-
171
-
172
-
173
-
174
-
175
-
176
-
177
-
178
-
179
-
180
-
181
-
182
-
183
-
184
-
185
-
186
-
187
-
188
-
189
-
190
-
191
-
192
-
193
-
194
-
195
-
196
-
197
-
198
-
199
-
200
-
201
-
202
-
203
-
204
-
205
-
206
-
207
-
208
-
209
-
210
 |
 |

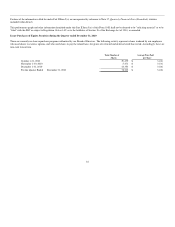
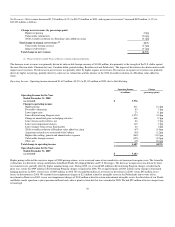
In 2009, we received $41 million in net proceeds and recorded pre-tax losses of $6 million on the divestitures of our Balance bar operations in the U.S., a
juice operation in Brazil and a plant in Spain. We recorded after-tax gains of $58 million, or $0.04 per diluted share, on these divestitures, primarily due to the
differing book and tax bases of our Balance bar operations.
In 2008, we received $153 million in net proceeds, and recorded pre-tax losses of $92 million on divestitures, primarily related to a Nordic and Baltic snacks
operation and four operations in Spain. We recorded after-tax losses of $64 million, or $0.04 per diluted share, on these divestitures.
Included in the 2008 divestitures were the following, which were a condition of the EU Commission's approval of our Groupe Danone S.A. global LU biscuit
business ("LU Biscuit") acquisition:
• We divested a biscuit operation in Spain. From this divestiture, we received $86 million in net proceeds and recorded pre-tax losses of $74
million.
• We divested another biscuit operation in Spain and a trademark in Hungary that we had previously acquired as part of the LU Biscuit acquisition.
As such, the impacts of these divestitures were reflected as adjustments to the purchase price allocations.
The aggregate operating results of the divestitures discussed above, other than the divestiture of the Frozen Pizza and Post cereals businesses, were not
material to our financial statements in any of the periods presented. Refer to Note 16, Segment Reporting, for details of the gains and losses on divestitures by
segment. The net impacts to segment operating income from gains and losses on divestitures, along with resulting asset impairment charges, are summarized
in the table with the Asset Impairment Charges section below.
Asset Impairment Charges
In 2010, we recorded aggregate asset impairment charges of $55 million, or $0.02 per diluted share. During our 2010 review of goodwill and non-amortizable
intangible assets, we recorded a $13 million charge for the impairment of intangible assets in the Netherlands and a $30 million charge for the impairment of
intangible assets in China. During the fourth quarter of 2010, we also recorded an asset impairment of $12 million on a biscuit plant and related property,
plant and equipment in France. We recorded the aggregate asset impairment charges within asset impairment and exit costs.
In 2009, we recorded aggregate asset impairment charges of $21 million, or $0.01 per diluted share. During our 2009 review of goodwill and non-amortizable
intangible assets, we recorded a $12 million charge for the impairment of intangible assets in the Netherlands. In addition, during 2009, we recorded a $9
million asset impairment charge to write off an investment in Norway. We recorded the aggregate asset impairment charges within asset impairment and exit
costs.
In 2008, we recorded aggregate asset impairment charges of $140 million, or $0.07 per diluted share. During our 2008 review of goodwill and non-
amortizable intangible assets, we recorded a $44 million charge for the impairment of intangible assets in the Netherlands, France and Puerto Rico. In
addition, in December 2008, we reached a preliminary agreement to divest a juice operation in Brazil and reached an agreement to sell a cheese plant in
Australia. In anticipation of divesting the juice operation in Brazil, we recorded an asset impairment charge of $13 million in the fourth quarter of 2008. The
charge primarily included the write-off of associated intangible assets of $8 million and property, plant and equipment of $4 million. In anticipation of selling
the cheese plant in Australia, we recorded an asset impairment charge of $28 million to property, plant and equipment in the fourth quarter of 2008.
Additionally, in 2008, we divested a Nordic and Baltic snacks operation, and incurred an asset impairment charge of $55 million in connection with the
divestiture. This charge primarily included the write-off of associated goodwill of $34 million and property, plant and equipment of $16 million. We recorded
the aggregate asset impairment charges within asset impairment and exit costs.
24