Kraft 2010 Annual Report Download - page 86
Download and view the complete annual report
Please find page 86 of the 2010 Kraft annual report below. You can navigate through the pages in the report by either clicking on the pages listed below, or by using the keyword search tool below to find specific information within the annual report.-
 1
1 -
2
-
3
-
4
-
5
-
6
-
7
-
8
-
9
-
10
-
11
-
12
-
13
-
14
-
15
-
16
-
17
-
18
-
19
-
20
-
21
-
22
-
23
-
24
-
25
-
26
-
27
-
28
-
29
-
30
-
31
-
32
-
33
-
34
-
35
-
36
-
37
-
38
-
39
-
40
-
41
-
42
-
43
-
44
-
45
-
46
-
47
-
48
-
49
-
50
-
51
-
52
-
53
-
54
-
55
-
56
-
57
-
58
-
59
-
60
-
61
-
62
-
63
-
64
-
65
-
66
-
67
-
68
-
69
-
70
-
71
-
72
-
73
-
74
-
75
-
 76
76 -
 77
77 -
 78
78 -
 79
79 -
 80
80 -
 81
81 -
 82
82 -
 83
83 -
 84
84 -
 85
85 -
 86
86 -
 87
87 -
 88
88 -
 89
89 -
 90
90 -
 91
91 -
 92
92 -
 93
93 -
 94
94 -
 95
95 -
 96
96 -
97
-
98
-
99
-
100
-
101
-
102
-
103
-
104
-
105
-
106
-
107
-
108
-
109
-
110
-
111
-
112
-
113
-
114
-
115
-
116
-
117
-
118
-
119
-
120
-
121
-
122
-
123
-
124
-
125
-
126
-
127
-
128
-
129
-
130
-
131
-
132
-
133
-
134
-
135
-
136
-
137
-
138
-
139
-
140
-
141
-
142
-
143
-
144
-
145
-
146
-
147
-
148
-
149
-
150
-
151
-
152
-
153
-
154
-
155
-
156
-
157
-
158
-
159
-
160
-
161
-
162
-
163
-
164
-
165
-
166
-
167
-
168
-
169
-
170
-
171
-
172
-
173
-
174
-
175
-
176
-
177
-
178
-
179
-
180
-
181
-
182
-
183
-
184
-
185
-
186
-
187
-
188
-
189
-
190
-
191
-
192
-
193
-
194
-
195
-
196
-
197
-
198
-
199
-
200
-
201
-
202
-
203
-
204
-
205
-
206
-
207
-
208
-
209
-
210
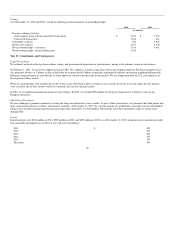
 |
 |

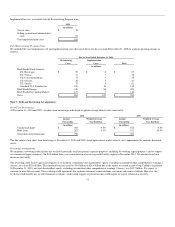
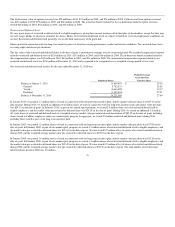
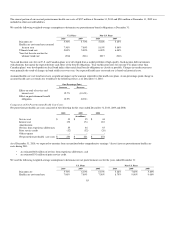
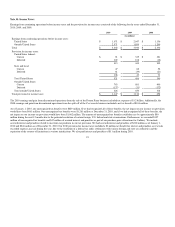
We excluded plan assets of $155 million at December 31, 2010 and $172 million at December 31, 2009 from the above tables related to certain insurance
contracts as they are reported at contract value, in accordance with authoritative guidance. U.S. and non-U.S. equity securities and government bonds are
primarily classified as level one and are valued using quoted prices in active markets. Corporate bonds and other fixed income securities are primarily
classified as level two and are valued using independent observable market inputs, such as matrix pricing, yield curves and indices. Pooled funds, including
assets in real estate pooled funds, are primarily classified as level two and are valued using net asset values of participation units held in common collective
trusts, as reported by the managers of the trusts and as supported by the unit prices of actual purchase and sale transactions. Level three assets are valued using
unobservable inputs that reflect the plans' assumptions that market participants would use in pricing the assets, based on the best information available. Fair
value estimates are calculated by the general partners for limited partnership and private equity investments using the market approach to estimate the fair
value of private investments. The market approach utilizes prices and other relevant information generated by market transactions, type of security, degree of
liquidity, restrictions on the disposition, latest round of financing data, company financial statements, relevant valuation multiples and discounted cash flow
analyses. Fair value estimates are calculated for real estate investments by the investment managers using the present value of future cash flows expected to be
received from the investments, based on valuation methodologies such as appraisals, local market conditions, and current and projected operating
performance. Fair value estimates are calculated for investments in hedge fund-of-funds by the investment managers using the net asset value per share of the
investment as reported by the money managers of the underlying funds. Fair value estimates are calculated for insurance contracts based on the future stream
of benefit payments discounted using prevailing interest rates based on the valuation date.
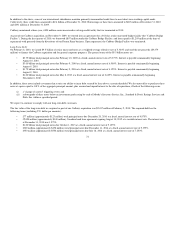
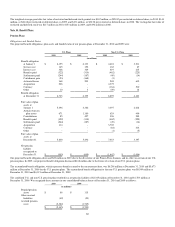
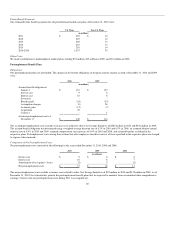
Below is a rollforward of our Level 3 assets for the year ended December 31, 2010.
Asset Category
January 1, 2010
Balance
Net Realized
and Unrealized
Gains/(Losses)
Net Purchases,
Issuances and
Settlements
Net Transfers
Into/(Out of)
Level 3
Currency
Impact
Level 3
December 31,
2010
Balance
(in millions)
Non-U.S. equity securities $ 1 $ - $ (1) $ - $ - $ -
Corporate bond and other
fixed income securities 2 23 (44) 789 (19) 751
Real Estate - 34 (1) 220 (3) 250
Other 2 29 12 341 (8) 376
Total Level 3
investments 5 86 (34) 1,350 (30) 1,377
The increases in Level 3 pension plan investments from December 31, 2009 were due to our Cadbury acquisition and the types of investments we acquired
in those plans. A rollforward of our Level 3 assets for 2009 was omitted as their value was insignificant to the total overall pension plan assets.
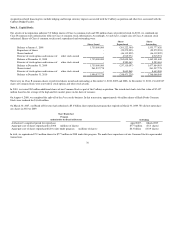
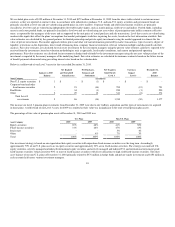
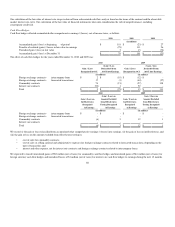
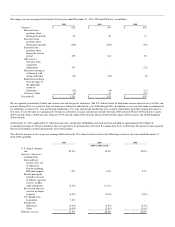
The percentage of fair value of pension plan assets at December 31, 2010 and 2009 was:
U.S. Plans Non-U.S. Plans
Asset Category 2010 2009 2010 2009
Equity securities 69% 68% 41% 50%
Fixed-income securities 31% 28% 47% 43%
Real estate - - 5% 4%
Other - 4% 7% 3%
Total 100% 100% 100% 100%
Our investment strategy is based on our expectation that equity securities will outperform fixed-income securities over the long term. Accordingly,
approximately 70% of our U.S. plan assets are in equity securities and approximately 30% are in fixed-income securities. The strategy uses indexed U.S.
equity securities, actively managed and indexed international equity securities and actively managed and indexed U.S. and international investment grade
fixed-income securities (which constitute 90% or more of fixed-income securities) with lesser allocations to high yield fixed-income securities. The other
asset balance of our non-U.S. plans at December 31, 2010 primarily related to $374 million in hedge funds and private equity investments and $150 million in
cash accounts held across various investment managers.
83