Kraft 2010 Annual Report Download - page 102
Download and view the complete annual report
Please find page 102 of the 2010 Kraft annual report below. You can navigate through the pages in the report by either clicking on the pages listed below, or by using the keyword search tool below to find specific information within the annual report.-
 1
1 -
2
-
3
-
4
-
5
-
6
-
7
-
8
-
9
-
10
-
11
-
12
-
13
-
14
-
15
-
16
-
17
-
18
-
19
-
20
-
21
-
22
-
23
-
24
-
25
-
26
-
27
-
28
-
29
-
30
-
31
-
32
-
33
-
34
-
35
-
36
-
37
-
38
-
39
-
40
-
41
-
42
-
43
-
44
-
45
-
46
-
47
-
48
-
49
-
50
-
51
-
52
-
53
-
54
-
55
-
56
-
57
-
58
-
59
-
60
-
61
-
62
-
63
-
64
-
65
-
66
-
67
-
68
-
69
-
70
-
71
-
72
-
73
-
74
-
75
-
76
-
77
-
78
-
79
-
80
-
81
-
82
-
83
-
84
-
85
-
86
-
87
-
88
-
89
-
90
-
91
-
 92
92 -
 93
93 -
 94
94 -
 95
95 -
 96
96 -
 97
97 -
 98
98 -
 99
99 -
 100
100 -
 101
101 -
 102
102 -
 103
103 -
 104
104 -
 105
105 -
 106
106 -
 107
107 -
 108
108 -
 109
109 -
 110
110 -
 111
111 -
 112
112 -
113
-
114
-
115
-
116
-
117
-
118
-
119
-
120
-
121
-
122
-
123
-
124
-
125
-
126
-
127
-
128
-
129
-
130
-
131
-
132
-
133
-
134
-
135
-
136
-
137
-
138
-
139
-
140
-
141
-
142
-
143
-
144
-
145
-
146
-
147
-
148
-
149
-
150
-
151
-
152
-
153
-
154
-
155
-
156
-
157
-
158
-
159
-
160
-
161
-
162
-
163
-
164
-
165
-
166
-
167
-
168
-
169
-
170
-
171
-
172
-
173
-
174
-
175
-
176
-
177
-
178
-
179
-
180
-
181
-
182
-
183
-
184
-
185
-
186
-
187
-
188
-
189
-
190
-
191
-
192
-
193
-
194
-
195
-
196
-
197
-
198
-
199
-
200
-
201
-
202
-
203
-
204
-
205
-
206
-
207
-
208
-
209
-
210
 |
 |

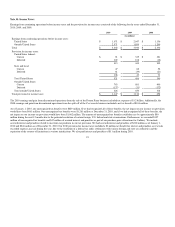
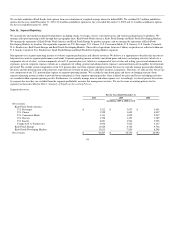
Net revenues by consumer sector, which reflects Kraft macaroni and cheese dinners in the Convenient Meals sector and separates Canada & N.A.
Foodservice, Kraft Foods Europe and Kraft Foods Developing Markets into sector components, were:
For the Year Ended December 31, 2010
Kraft Foods
North America
Kraft Foods
Europe
Kraft Foods
Developing
Markets
Total
(in millions)
Biscuits (1) $ 5,646 $ 2,322 $ 2,815 $ 10,783
Confectionery (1) 1,807 5,224 6,657 13,688
Beverages 3,742 2,522 2,536 8,800
Cheese 5,090 982 904 6,976
Grocery 3,088 334 579 4,001
Convenient Meals 4,593 244 122 4,959
Total net revenues $ 23,966 $ 11,628 $ 13,613 $ 49,207
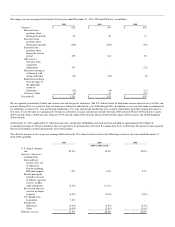
For the Year Ended December 31, 2009
Kraft Foods
North America
Kraft Foods
Europe
Kraft Foods
Developing
Markets Total
(in millions; as revised)
Biscuits (1) $ 5,628 $ 2,330 $ 2,446 $ 10,404
Confectionery (1) 301 2,446 1,891 4,638
Beverages 3,545 2,390 2,094 8,029
Cheese 4,980 972 844 6,796
Grocery 3,136 369 566 4,071
Convenient Meals 4,440 261 115 4,816
Total net revenues $ 22,030 $ 8,768 $ 7,956 $ 38,754
For the Year Ended December 31, 2008
Kraft Foods
North America
Kraft Foods
Europe
Kraft Foods
Developing
Markets Total
(in millions; as revised)
Biscuits (1) $ 5,659 $ 2,706 $ 2,592 $ 10,957
Confectionery (1) 292 2,585 2,076 4,953
Beverages 3,509 2,625 2,081 8,215
Cheese 5,525 1,109 828 7,462
Grocery 3,211 394 567 4,172
Convenient Meals 4,320 309 104 4,733
Total net revenues $ 22,516 $ 9,728 $ 8,248 $ 40,492
(1) We previously reported Biscuits and Confectionery combined as Snacks. With the Cadbury acquisition, the Biscuits and
Confectionery sectors have been broken out separately. The Biscuits sector primarily includes Cookies, Crackers and Salted Snacks. The Confectionery sector primarily includes
Chocolate, Gum and Candy.
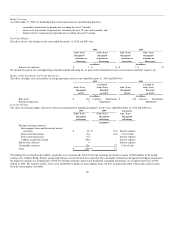
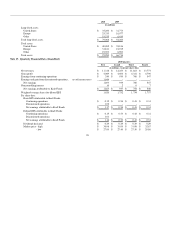
Geographic data for net revenues, long-lived assets and total assets were:
For the Years Ended December 31,
2010 2009 2008
(in millions; 2009 & 2008 revised)
Net revenues:
United States $ 20,934 $ 19,713 $ 20,168
Europe 15,733 11,471 12,868
Other 12,540 7,570 7,456
Total net revenues $ 49,207 $ 38,754 $ 40,492
97