Kraft 2010 Annual Report Download - page 35
Download and view the complete annual report
Please find page 35 of the 2010 Kraft annual report below. You can navigate through the pages in the report by either clicking on the pages listed below, or by using the keyword search tool below to find specific information within the annual report.-
 1
1 -
2
-
3
-
4
-
5
-
6
-
7
-
8
-
9
-
10
-
11
-
12
-
13
-
14
-
15
-
16
-
17
-
18
-
19
-
20
-
21
-
22
-
23
-
24
-
 25
25 -
 26
26 -
 27
27 -
 28
28 -
 29
29 -
 30
30 -
 31
31 -
 32
32 -
 33
33 -
 34
34 -
 35
35 -
 36
36 -
 37
37 -
 38
38 -
 39
39 -
 40
40 -
 41
41 -
 42
42 -
 43
43 -
 44
44 -
 45
45 -
46
-
47
-
48
-
49
-
50
-
51
-
52
-
53
-
54
-
55
-
56
-
57
-
58
-
59
-
60
-
61
-
62
-
63
-
64
-
65
-
66
-
67
-
68
-
69
-
70
-
71
-
72
-
73
-
74
-
75
-
76
-
77
-
78
-
79
-
80
-
81
-
82
-
83
-
84
-
85
-
86
-
87
-
88
-
89
-
90
-
91
-
92
-
93
-
94
-
95
-
96
-
97
-
98
-
99
-
100
-
101
-
102
-
103
-
104
-
105
-
106
-
107
-
108
-
109
-
110
-
111
-
112
-
113
-
114
-
115
-
116
-
117
-
118
-
119
-
120
-
121
-
122
-
123
-
124
-
125
-
126
-
127
-
128
-
129
-
130
-
131
-
132
-
133
-
134
-
135
-
136
-
137
-
138
-
139
-
140
-
141
-
142
-
143
-
144
-
145
-
146
-
147
-
148
-
149
-
150
-
151
-
152
-
153
-
154
-
155
-
156
-
157
-
158
-
159
-
160
-
161
-
162
-
163
-
164
-
165
-
166
-
167
-
168
-
169
-
170
-
171
-
172
-
173
-
174
-
175
-
176
-
177
-
178
-
179
-
180
-
181
-
182
-
183
-
184
-
185
-
186
-
187
-
188
-
189
-
190
-
191
-
192
-
193
-
194
-
195
-
196
-
197
-
198
-
199
-
200
-
201
-
202
-
203
-
204
-
205
-
206
-
207
-
208
-
209
-
210
 |
 |

Canada & N.A. Foodservice, Kraft Foods Europe and Kraft Foods Developing Markets. The results of operations from our Cadbury acquisition (including
Integration Program and acquisition-related costs), are reflected within our U.S. Snacks, Canada & N.A. Foodservice, Kraft Foods Europe and Kraft Foods
Developing Markets segments.
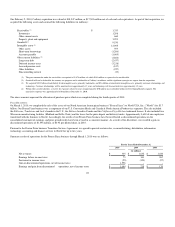
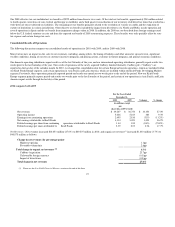
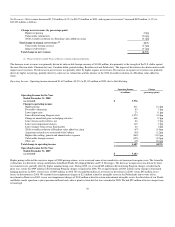
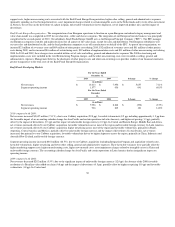
The following discussion compares our results of operations for each of our reportable segments for 2010 with 2009, and for 2009 with 2008.
For the Years Ended December 31,
2010 2009 2008
(in millions; 2009 & 2008 revised)
Net revenues:
Kraft Foods North America:
U.S. Beverages $ 3,212 $ 3,057 $ 3,001
U.S. Cheese 3,528 3,605 4,007
U.S. Convenient Meals 3,131 3,029 2,947
U.S. Grocery 3,398 3,453 3,389
U.S. Snacks 6,001 4,964 5,025
Canada & N.A. Foodservice 4,696 3,922 4,147
Kraft Foods Europe 11,628 8,768 9,728
Kraft Foods Developing Markets 13,613 7,956 8,248
Net revenues $ 49,207 $ 38,754 $ 40,492
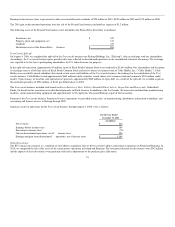
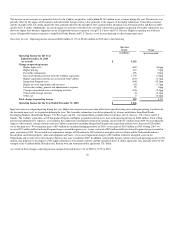
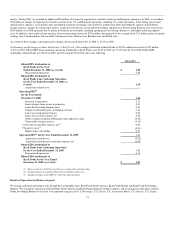
For the Years Ended December 31,
2010 2009 2008
(in millions; 2009 & 2008 revised)
Operating income:
Kraft Foods North America:
U.S. Beverages $ 564 $ 511 $ 381
U.S. Cheese 598 667 563
U.S. Convenient Meals 268 234 125
U.S. Grocery 1,164 1,146 1,009
U.S. Snacks 845 723 638
Canada & N.A. Foodservice 582 462 395
Kraft Foods Europe 1,115 785 182
Kraft Foods Developing Markets 1,577 936 815
Unrealized gains / (losses) on hedging activities 67 203 (205)
Certain U.S. pension plan costs (179) (165) -
General corporate expenses (724) (293) (304)
Amortization of intangibles (211) (26) (23)
Operating income $ 5,666 $ 5,183 $ 3,576
As discussed in Note 16, Segment Reporting, management uses segment operating income to evaluate segment performance and allocate resources. We
believe it is appropriate to disclose this measure to help investors analyze segment performance and trends. Segment operating income excludes unrealized
gains and losses on hedging activities (which are a component of cost of sales), certain components of our U.S. pension plan cost (which are a component of
cost of sales and selling, general and administrative expenses), general corporate expenses (which are a component of selling, general and administrative
expenses) and amortization of intangibles for all periods presented. We exclude the unrealized gains and losses on hedging activities from segment operating
income in order to provide better transparency of our segment operating results. Once realized, the gains and losses on hedging activities are recorded within
segment operating results. We exclude certain components of our U.S. pension plan cost from segment operating income because we centrally manage
pension plan funding decisions and the determination of discount rate, expected rate of return on plan assets and other actuarial assumptions. Therefore, we
allocate only the service cost component of our U.S. pension plan expense to segment operating income.
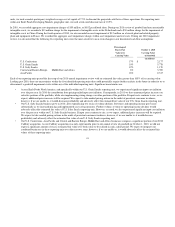
In 2010, the change in unrealized gains on hedging activities of $67 million primarily resulted from gains associated with commodity hedging activities. In
2009, the change in unrealized gains on hedging activities of $203 million primarily resulted from the 2008 unrealized losses on energy derivatives becoming
realized in 2009 and therefore,
32