Kraft 2010 Annual Report Download - page 36
Download and view the complete annual report
Please find page 36 of the 2010 Kraft annual report below. You can navigate through the pages in the report by either clicking on the pages listed below, or by using the keyword search tool below to find specific information within the annual report.-
 1
1 -
2
-
3
-
4
-
5
-
6
-
7
-
8
-
9
-
10
-
11
-
12
-
13
-
14
-
15
-
16
-
17
-
18
-
19
-
20
-
21
-
22
-
23
-
24
-
25
-
 26
26 -
 27
27 -
 28
28 -
 29
29 -
 30
30 -
 31
31 -
 32
32 -
 33
33 -
 34
34 -
 35
35 -
 36
36 -
 37
37 -
 38
38 -
 39
39 -
 40
40 -
 41
41 -
 42
42 -
 43
43 -
 44
44 -
 45
45 -
 46
46 -
47
-
48
-
49
-
50
-
51
-
52
-
53
-
54
-
55
-
56
-
57
-
58
-
59
-
60
-
61
-
62
-
63
-
64
-
65
-
66
-
67
-
68
-
69
-
70
-
71
-
72
-
73
-
74
-
75
-
76
-
77
-
78
-
79
-
80
-
81
-
82
-
83
-
84
-
85
-
86
-
87
-
88
-
89
-
90
-
91
-
92
-
93
-
94
-
95
-
96
-
97
-
98
-
99
-
100
-
101
-
102
-
103
-
104
-
105
-
106
-
107
-
108
-
109
-
110
-
111
-
112
-
113
-
114
-
115
-
116
-
117
-
118
-
119
-
120
-
121
-
122
-
123
-
124
-
125
-
126
-
127
-
128
-
129
-
130
-
131
-
132
-
133
-
134
-
135
-
136
-
137
-
138
-
139
-
140
-
141
-
142
-
143
-
144
-
145
-
146
-
147
-
148
-
149
-
150
-
151
-
152
-
153
-
154
-
155
-
156
-
157
-
158
-
159
-
160
-
161
-
162
-
163
-
164
-
165
-
166
-
167
-
168
-
169
-
170
-
171
-
172
-
173
-
174
-
175
-
176
-
177
-
178
-
179
-
180
-
181
-
182
-
183
-
184
-
185
-
186
-
187
-
188
-
189
-
190
-
191
-
192
-
193
-
194
-
195
-
196
-
197
-
198
-
199
-
200
-
201
-
202
-
203
-
204
-
205
-
206
-
207
-
208
-
209
-
210
 |
 |

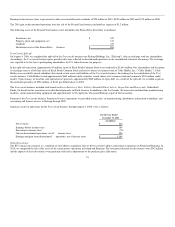
included in segment operating income. In 2008, the change in unrealized losses on hedging activities of $205 million primarily related to energy derivatives,
including heating oil (used primarily to hedge transportation costs) and natural gas contracts.
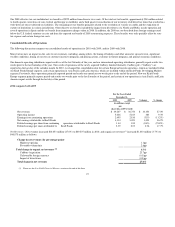
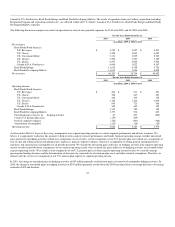
The 2010 increase in general corporate expenses was primarily due to acquisition-related transaction fees, Integration Program costs and the impact of
Cadbury's corporate charges. We incurred acquisition-related transaction fees of $218 million in 2010 and $40 million in 2009. We recorded these charges in
operations as part of general corporate expenses. In 2009, general corporate expenses included $50 million of charges for legal matters related to certain of
our European operations. In 2008 we recorded $72 million in charges for legal matters related to certain of our U.S. and European operations, including U.S.
coffee operations and represented the primary reason general corporate expenses increased $101 million in 2008.
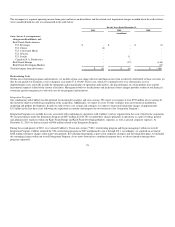
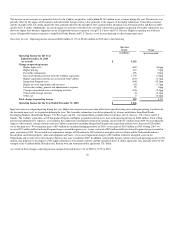
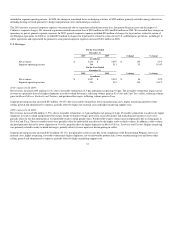
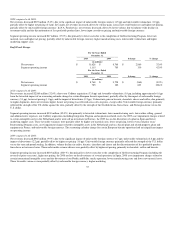
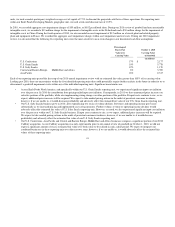
U.S. Beverages
For the Years Ended
December 31,
2010 2009 $ change % change
(in millions)
Net revenues $ 3,212 $ 3,057 $ 155 5.1%
Segment operating income 564 511 53 10.4%
For the Years Ended
December 31,
2009 2008 $ change % change
(in millions)
Net revenues $ 3,057 $ 3,001 $ 56 1.9%
Segment operating income 511 381 130 34.1%
2010 compared with 2009:
Net revenues increased $155 million (5.1%), due to favorable volume/mix (4.5 pp) and higher net pricing (0.6 pp). The favorable volume/mix impact on net
revenue was primarily driven by higher shipments in ready-to-drink beverages, reflecting volume gains in Kool-Aid and Capri Sun; coffee, reflecting volume
gains in Maxwell House, Starbucks and Tassimo; and powdered beverages, reflecting volume gains in Tang.
Segment operating income increased $53 million (10.4%), due to favorable volume/mix, lower manufacturing costs, higher net pricing and lower other
selling, general and administrative expenses, partially offset by higher raw material costs and higher marketing support costs.
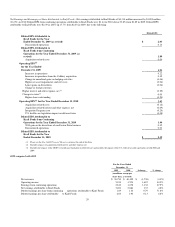
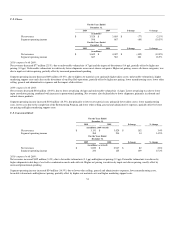
2009 compared with 2008:
Net revenues increased $56 million (1.9%), due to favorable volume/mix (1.3 pp) and higher net pricing (0.6 pp). Favorable volume/mix was driven by higher
shipments in ready-to-drink and powdered beverages. Ready-to-drink beverages grew from successful quality and marketing investments in Capri Sun,
partially offset by the discontinuation of less profitable ready-to-drink product lines. Powdered beverages volume increased primarily due to strong gains in
Kool-Aid and Tang. These favorable factors were partially offset by unfavorable mix driven by the higher ready-to-drink volume. In addition, coffee volume
declined primarily driven by lower shipments of Gevalia, partially offset by higher shipments in Maxwell House, Starbucks and Tassimo. Higher net pricing
was primarily related to ready-to-drink beverages, partially offset by lower input cost-driven pricing in coffee.
Segment operating income increased $130 million (34.1%), due primarily to lower costs due to the completion of the Restructuring Program, lower raw
material costs, higher net pricing, favorable volume/mix (higher shipments, net of unfavorable product mix), lower manufacturing costs and lower other
selling, general and administrative expenses, partially offset by higher marketing support costs.
33