Kraft 2010 Annual Report Download - page 83
Download and view the complete annual report
Please find page 83 of the 2010 Kraft annual report below. You can navigate through the pages in the report by either clicking on the pages listed below, or by using the keyword search tool below to find specific information within the annual report.-
 1
1 -
2
-
3
-
4
-
5
-
6
-
7
-
8
-
9
-
10
-
11
-
12
-
13
-
14
-
15
-
16
-
17
-
18
-
19
-
20
-
21
-
22
-
23
-
24
-
25
-
26
-
27
-
28
-
29
-
30
-
31
-
32
-
33
-
34
-
35
-
36
-
37
-
38
-
39
-
40
-
41
-
42
-
43
-
44
-
45
-
46
-
47
-
48
-
49
-
50
-
51
-
52
-
53
-
54
-
55
-
56
-
57
-
58
-
59
-
60
-
61
-
62
-
63
-
64
-
65
-
66
-
67
-
68
-
69
-
70
-
71
-
72
-
 73
73 -
 74
74 -
 75
75 -
 76
76 -
 77
77 -
 78
78 -
 79
79 -
 80
80 -
 81
81 -
 82
82 -
 83
83 -
 84
84 -
 85
85 -
 86
86 -
 87
87 -
 88
88 -
 89
89 -
 90
90 -
 91
91 -
 92
92 -
 93
93 -
94
-
95
-
96
-
97
-
98
-
99
-
100
-
101
-
102
-
103
-
104
-
105
-
106
-
107
-
108
-
109
-
110
-
111
-
112
-
113
-
114
-
115
-
116
-
117
-
118
-
119
-
120
-
121
-
122
-
123
-
124
-
125
-
126
-
127
-
128
-
129
-
130
-
131
-
132
-
133
-
134
-
135
-
136
-
137
-
138
-
139
-
140
-
141
-
142
-
143
-
144
-
145
-
146
-
147
-
148
-
149
-
150
-
151
-
152
-
153
-
154
-
155
-
156
-
157
-
158
-
159
-
160
-
161
-
162
-
163
-
164
-
165
-
166
-
167
-
168
-
169
-
170
-
171
-
172
-
173
-
174
-
175
-
176
-
177
-
178
-
179
-
180
-
181
-
182
-
183
-
184
-
185
-
186
-
187
-
188
-
189
-
190
-
191
-
192
-
193
-
194
-
195
-
196
-
197
-
198
-
199
-
200
-
201
-
202
-
203
-
204
-
205
-
206
-
207
-
208
-
209
-
210
 |
 |

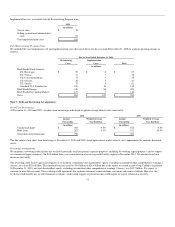
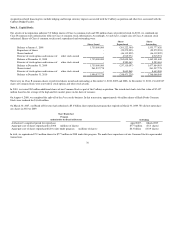
The weighted-average grant date fair value of restricted and deferred stock granted was $167 million, or $28.82 per restricted or deferred share, in 2010, $143
million, or $24.68 per restricted or deferred share, in 2009, and $151 million, or $30.38 per restricted or deferred share, in 2008. The vesting date fair value of
restricted and deferred stock was $117 million in 2010, $153 million in 2009, and $196 million in 2008.
Note 11. Benefit Plans:
Pension Plans
Obligations and Funded Status:
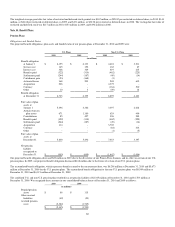
The projected benefit obligations, plan assets and funded status of our pension plans at December 31, 2010 and 2009 were:
U.S. Plans Non-U.S. Plans
2010 2009 2010 2009
(in millions)
Benefit obligation
at January 1 $ 6,195 $ 6,133 $ 4,401 $ 3,211
Service cost 145 152 162 67
Interest cost 368 369 419 215
Benefits paid (322) (310) (462) (225)
Settlements paid (244) (187) (49) (14)
Curtailment gain (23) (168) (3) -
Actuarial losses 368 203 265 619
Acquisition 206 - 4,375 -
Currency - - (164) 510
Other 10 3 (49) 18
Benefit obligation
at December 31 6,703 6,195 8,895 4,401
Fair value of plan
assets at
January 1 5,496 4,386 3,397 2,618
Actual return on
plan assets 671 1,180 624 400
Contributions 85 427 326 209
Benefits paid (322) (310) (462) (225)
Settlements paid (244) (187) (49) (14)
Acquisition 114 - 3,702 -
Currency - - (84) 414
Other - - (1) (5)
Fair value of plan
assets at
December 31 5,800 5,496 7,453 3,397
Net pension
liability
recognized at
December 31 $ (903) $ (699) $ (1,442) $ (1,004)
Our projected benefit obligation decreased $23 million in 2010 due to the divestiture of our Frozen Pizza business and its effect on certain of our U.S.
pension plans. In 2009, our projected benefit obligation decreased $168 million due to the freeze of certain of our U.S. pension plans.
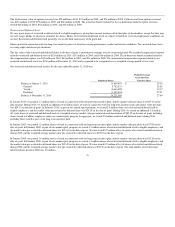
The accumulated benefit obligation, which represents benefits earned to the measurement date, was $6,208 million at December 31, 2010 and $5,673
million at December 31, 2009 for the U.S. pension plans. The accumulated benefit obligation for the non-U.S. pension plans was $8,549 million at
December 31, 2010 and $4,115 million at December 31, 2009.
The combined U.S. and non-U.S. pension plans resulted in a net pension liability of $2,345 million at December 31, 2010 and $1,703 million at
December 31, 2009. We recognized these amounts in our consolidated balance sheets at December 31, 2010 and 2009 as follows:
2010 2009
(in millions)
Prepaid pension
assets $ 86 $ 115
Other accrued
liabilities (49) (53)
Accrued pension
costs (2,382) (1,765)
$ (2,345) $ (1,703)
80