Kraft 2010 Annual Report Download - page 55
Download and view the complete annual report
Please find page 55 of the 2010 Kraft annual report below. You can navigate through the pages in the report by either clicking on the pages listed below, or by using the keyword search tool below to find specific information within the annual report.-
 1
1 -
2
-
3
-
4
-
5
-
6
-
7
-
8
-
9
-
10
-
11
-
12
-
13
-
14
-
15
-
16
-
17
-
18
-
19
-
20
-
21
-
22
-
23
-
24
-
25
-
26
-
27
-
28
-
29
-
30
-
31
-
32
-
33
-
34
-
35
-
36
-
37
-
38
-
39
-
40
-
41
-
42
-
43
-
44
-
 45
45 -
 46
46 -
 47
47 -
 48
48 -
 49
49 -
 50
50 -
 51
51 -
 52
52 -
 53
53 -
 54
54 -
 55
55 -
 56
56 -
 57
57 -
 58
58 -
 59
59 -
 60
60 -
 61
61 -
 62
62 -
 63
63 -
 64
64 -
 65
65 -
66
-
67
-
68
-
69
-
70
-
71
-
72
-
73
-
74
-
75
-
76
-
77
-
78
-
79
-
80
-
81
-
82
-
83
-
84
-
85
-
86
-
87
-
88
-
89
-
90
-
91
-
92
-
93
-
94
-
95
-
96
-
97
-
98
-
99
-
100
-
101
-
102
-
103
-
104
-
105
-
106
-
107
-
108
-
109
-
110
-
111
-
112
-
113
-
114
-
115
-
116
-
117
-
118
-
119
-
120
-
121
-
122
-
123
-
124
-
125
-
126
-
127
-
128
-
129
-
130
-
131
-
132
-
133
-
134
-
135
-
136
-
137
-
138
-
139
-
140
-
141
-
142
-
143
-
144
-
145
-
146
-
147
-
148
-
149
-
150
-
151
-
152
-
153
-
154
-
155
-
156
-
157
-
158
-
159
-
160
-
161
-
162
-
163
-
164
-
165
-
166
-
167
-
168
-
169
-
170
-
171
-
172
-
173
-
174
-
175
-
176
-
177
-
178
-
179
-
180
-
181
-
182
-
183
-
184
-
185
-
186
-
187
-
188
-
189
-
190
-
191
-
192
-
193
-
194
-
195
-
196
-
197
-
198
-
199
-
200
-
201
-
202
-
203
-
204
-
205
-
206
-
207
-
208
-
209
-
210
 |
 |

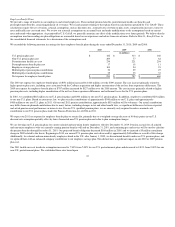
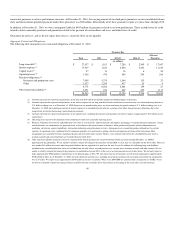
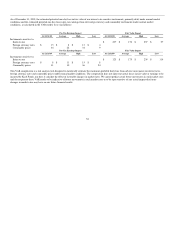
2009 2008 $ Change % Change
(in millions; as revised)
Organic net revenues $ 40,565 $ 40,137 $ 428 1.1%
Impact of divestitures 73 355 (282) (0.7)pp
Impact of acquisitions - - - -
Impact of foreign currency (1,884) - (1,884) (4.7)pp
Reported net revenues $ 38,754 $ 40,492 $ (1,738) (4.3)%
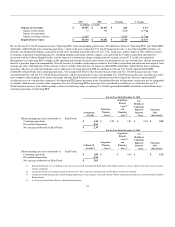
We use the non-U.S. GAAP financial measure "Operating EPS" and corresponding growth ratios. The difference between "Operating EPS" and "diluted EPS
attributable to Kraft Foods from continuing operations," which is the most comparable U.S. GAAP financial measure, is that Operating EPS excludes costs
related to: the Integration Program; acquisition-related costs, including transaction advisory fees, U.K. stamp taxes and the impact of the Cadbury inventory
revaluation; acquisition-related financing fees, including hedging and foreign currency impacts associated with the Cadbury acquisition and other fees
associated with the Cadbury Bridge Facility; and the impact of a deferred tax charge resulting from the recently enacted U.S. health care legislation.
Management uses Operating EPS to budget, make operating and strategic decisions and evaluate our performance on a go-forward basis, and our management
believes it provides improved comparability of results because it excludes certain impacts related to the Cadbury acquisition and other one-time impacts from
earnings per share. The limitation of this measure is that it excludes items that have an impact on diluted EPS attributable to Kraft Foods from continuing
operations. The best way that this limitation can be addressed is by using Operating EPS in combination with our U.S. GAAP reported diluted EPS
attributable to Kraft Foods from continuing operations. Our management believes that the presentation of this non-U.S. GAAP financial measure, when
considered together with our U.S. GAAP financial measures and the reconciliations to the corresponding U.S. GAAP financial measures, provides you with a
more complete understanding of the factors and trends affecting Kraft Foods than could be obtained absent these disclosures. Because Operating EPS
calculations may vary among other companies, the Operating EPS figures presented in the Consolidated Results of Operations section may not be comparable
to similarly titled measures used by other companies. Our use of Operating EPS is not meant to be considered in isolation or as a substitute for any U.S.
GAAP financial measure. You should carefully evaluate the following tables reconciling U.S. GAAP reported diluted EPS attributable to Kraft Foods from
continuing operations to Operating EPS.
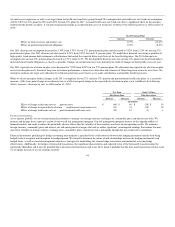
For the Year Ended December 31, 2010
As Reported
(GAAP)
Integration
Program
Costs (1)
Acquisition-
Related
Costs (2)
and
Financing
Fees (3)
U.S.
Healthcare
Legislation
Impact on
Deferred
Taxes
Operating
EPS
(Non-GAAP)
Diluted earnings per share attributable to Kraft Foods:
Continuing operations $ 1.44 $ 0.29 $ 0.21 $ 0.08 $ 2.02
Discontinued operations 0.95
Net earnings attributable to Kraft Foods $ 2.39
For the Year Ended December 31, 2009
As Reported
(GAAP)(4)
Integration
Program
Costs (1)
Acquisition-
Related
Costs (2)
and
Financing
Fees (3)
U.S.
Healthcare
Legislation
Impact on
Deferred
Taxes
Operating
EPS
(Non-GAAP)
Diluted earnings per share attributable to Kraft Foods:
Continuing operations $ 1.89 $ - $ 0.04 $ - $ 1.93
Discontinued operations 0.14
Net earnings attributable to Kraft Foods $ 2.03
(1) Integration Program costs are defined as the costs associated with combining the Kraft Foods and Cadbury businesses, and are separate from those costs associated
with the acquisition.
(2) Acquisition-related costs include transaction advisory fees, U.K. stamp taxes and the impact of the Cadbury inventory revaluation.
(3) Acquisition-related financing fees include hedging and foreign currency impacts associated with the Cadbury acquisition and other fees associated with the Cadbury
Bridge Facility.
(4) As revised to reflect Frozen Pizza as a discontinued operation.
52