Kraft 2010 Annual Report Download - page 98
Download and view the complete annual report
Please find page 98 of the 2010 Kraft annual report below. You can navigate through the pages in the report by either clicking on the pages listed below, or by using the keyword search tool below to find specific information within the annual report.-
 1
1 -
2
-
3
-
4
-
5
-
6
-
7
-
8
-
9
-
10
-
11
-
12
-
13
-
14
-
15
-
16
-
17
-
18
-
19
-
20
-
21
-
22
-
23
-
24
-
25
-
26
-
27
-
28
-
29
-
30
-
31
-
32
-
33
-
34
-
35
-
36
-
37
-
38
-
39
-
40
-
41
-
42
-
43
-
44
-
45
-
46
-
47
-
48
-
49
-
50
-
51
-
52
-
53
-
54
-
55
-
56
-
57
-
58
-
59
-
60
-
61
-
62
-
63
-
64
-
65
-
66
-
67
-
68
-
69
-
70
-
71
-
72
-
73
-
74
-
75
-
76
-
77
-
78
-
79
-
80
-
81
-
82
-
83
-
84
-
85
-
86
-
87
-
 88
88 -
 89
89 -
 90
90 -
 91
91 -
 92
92 -
 93
93 -
 94
94 -
 95
95 -
 96
96 -
 97
97 -
 98
98 -
 99
99 -
 100
100 -
 101
101 -
 102
102 -
 103
103 -
 104
104 -
 105
105 -
 106
106 -
 107
107 -
 108
108 -
109
-
110
-
111
-
112
-
113
-
114
-
115
-
116
-
117
-
118
-
119
-
120
-
121
-
122
-
123
-
124
-
125
-
126
-
127
-
128
-
129
-
130
-
131
-
132
-
133
-
134
-
135
-
136
-
137
-
138
-
139
-
140
-
141
-
142
-
143
-
144
-
145
-
146
-
147
-
148
-
149
-
150
-
151
-
152
-
153
-
154
-
155
-
156
-
157
-
158
-
159
-
160
-
161
-
162
-
163
-
164
-
165
-
166
-
167
-
168
-
169
-
170
-
171
-
172
-
173
-
174
-
175
-
176
-
177
-
178
-
179
-
180
-
181
-
182
-
183
-
184
-
185
-
186
-
187
-
188
-
189
-
190
-
191
-
192
-
193
-
194
-
195
-
196
-
197
-
198
-
199
-
200
-
201
-
202
-
203
-
204
-
205
-
206
-
207
-
208
-
209
-
210
 |
 |

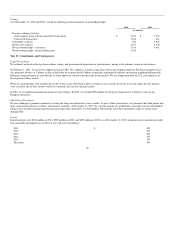
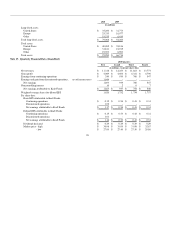
We exclude antidilutive Kraft Foods stock options from our calculation of weighted-average shares for diluted EPS. We excluded 28.5 million antidilutive
options for the year ended December 31, 2010, 23.0 million antidilutive options for the year ended December 31, 2009 and 11.3 million antidilutive options
for the year ended December 31, 2008.
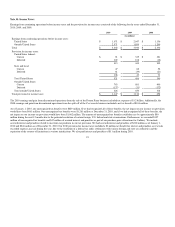
Note 16. Segment Reporting:
We manufacture and market packaged food products, including snacks, beverages, cheese, convenient meals and various packaged grocery products. We
manage and report operating results through three geographic units: Kraft Foods North America, Kraft Foods Europe and Kraft Foods Developing Markets.
We manage the operations of Kraft Foods North America and Kraft Foods Europe by product category, and we manage the operations of Kraft Foods
Developing Markets by location. Our reportable segments are U.S. Beverages, U.S. Cheese, U.S. Convenient Meals, U.S. Grocery, U.S. Snacks, Canada &
N.A. Foodservice, Kraft Foods Europe and Kraft Foods Developing Markets. The results of operations from our Cadbury acquisition are reflected within our
U.S. Snacks, Canada & N.A. Foodservice, Kraft Foods Europe and Kraft Foods Developing Markets segments.
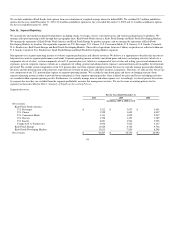
Management uses segment operating income to evaluate segment performance and allocate resources. We believe it is appropriate to disclose this measure to
help investors analyze segment performance and trends. Segment operating income excludes unrealized gains and losses on hedging activities (which are a
component of cost of sales), certain components of our U.S. pension plan cost (which is a component of cost of sales and selling, general and administrative
expenses), general corporate expenses (which are a component of selling, general and administrative expenses) and amortization of intangibles for all periods
presented. We exclude certain components of our U.S. pension plan cost from segment operating income because we centrally manage pension plan funding
decisions and the determination of discount rate, expected rate of return on plan assets and other actuarial assumptions. Therefore, we allocate only the service
cost component of our U.S. pension plan expense to segment operating income. We exclude the unrealized gains and losses on hedging activities from
segment operating income in order to provide better transparency of our segment operating results. Once realized, the gains and losses on hedging activities
are recorded within segment operating results. Furthermore, we centrally manage interest and other expense, net. Accordingly, we do not present these items
by segment because they are excluded from the segment profitability measure that management reviews. We use the same accounting policies for the
segments as those described in Note 1, Summary of Significant Accounting Policies.
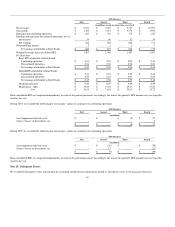
Segment data were:
For the Years Ended December 31,
2010 2009 2008
(in millions; 2009 & 2008 revised)
Net revenues:
Kraft Foods North America:
U.S. Beverages $ 3,212 $ 3,057 $ 3,001
U.S. Cheese 3,528 3,605 4,007
U.S. Convenient Meals 3,131 3,029 2,947
U.S. Grocery 3,398 3,453 3,389
U.S. Snacks 6,001 4,964 5,025
Canada & N.A. Foodservice 4,696 3,922 4,147
Kraft Foods Europe 11,628 8,768 9,728
Kraft Foods Developing Markets 13,613 7,956 8,248
Net revenues $ 49,207 $ 38,754 $ 40,492
94