Chrysler 2015 Annual Report Download - page 75
Download and view the complete annual report
Please find page 75 of the 2015 Chrysler annual report below. You can navigate through the pages in the report by either clicking on the pages listed below, or by using the keyword search tool below to find specific information within the annual report.-
 1
1 -
2
-
3
-
4
-
5
-
6
-
7
-
8
-
9
-
10
-
11
-
12
-
13
-
14
-
15
-
16
-
17
-
18
-
19
-
20
-
21
-
22
-
23
-
24
-
25
-
26
-
27
-
28
-
29
-
30
-
31
-
32
-
33
-
34
-
35
-
36
-
37
-
38
-
39
-
40
-
41
-
42
-
43
-
44
-
45
-
46
-
47
-
48
-
49
-
50
-
51
-
52
-
53
-
54
-
55
-
56
-
57
-
58
-
59
-
60
-
61
-
62
-
63
-
64
-
 65
65 -
 66
66 -
 67
67 -
 68
68 -
 69
69 -
 70
70 -
 71
71 -
 72
72 -
 73
73 -
 74
74 -
 75
75 -
 76
76 -
 77
77 -
 78
78 -
 79
79 -
 80
80 -
 81
81 -
 82
82 -
 83
83 -
 84
84 -
 85
85 -
86
-
87
-
88
-
89
-
90
-
91
-
92
-
93
-
94
-
95
-
96
-
97
-
98
-
99
-
100
-
101
-
102
-
103
-
104
-
105
-
106
-
107
-
108
-
109
-
110
-
111
-
112
-
113
-
114
-
115
-
116
-
117
-
118
-
119
-
120
-
121
-
122
-
123
-
124
-
125
-
126
-
127
-
128
-
129
-
130
-
131
-
132
-
133
-
134
-
135
-
136
-
137
-
138
-
139
-
140
-
141
-
142
-
143
-
144
-
145
-
146
-
147
-
148
-
149
-
150
-
151
-
152
-
153
-
154
-
155
-
156
-
157
-
158
-
159
-
160
-
161
-
162
-
163
-
164
-
165
-
166
-
167
-
168
-
169
-
170
-
171
-
172
-
173
-
174
-
175
-
176
-
177
-
178
-
179
-
180
-
181
-
182
-
183
-
184
-
185
-
186
-
187
-
188
-
189
-
190
-
191
-
192
-
193
-
194
-
195
-
196
-
197
-
198
-
199
-
200
-
201
-
202
-
203
-
204
-
205
-
206
-
207
-
208
-
209
-
210
-
211
-
212
-
213
-
214
-
215
-
216
-
217
-
218
-
219
-
220
-
221
-
222
-
223
-
224
-
225
-
226
-
227
-
228
-
229
-
230
-
231
-
232
-
233
-
234
-
235
-
236
-
237
-
238
-
239
-
240
-
241
-
242
-
243
-
244
-
245
-
246
-
247
-
248
-
249
-
250
-
251
-
252
-
253
-
254
-
255
-
256
-
257
-
258
-
259
-
260
-
261
-
262
-
263
-
264
-
265
-
266
-
267
-
268
-
269
-
270
-
271
-
272
-
273
-
274
-
275
-
276
-
277
-
278
-
279
-
280
-
281
-
282
-
283
-
284
-
285
-
286
-
287
-
288
 |
 |

2015 | ANNUAL REPORT 75
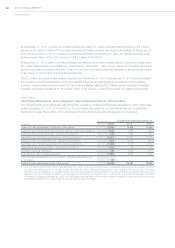
Change in Net Industrial Debt
As described in the section —Non-GAAP Financial Measures above, Net Industrial Debt is management’s primary
measure for analyzing our financial leverage and capital structure and is one of the key targets used to measure our
performance. The following section sets forth an explanation of the changes in our Net Industrial Debt during 2015,
2014 and 2013.
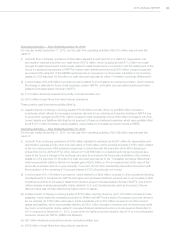
2015
In 2015, Net Industrial Debt decreased by €2,605 million from €7,654 million at December31, 2014, which included
Ferrari’s Net Industrial Debt to €5,049 million at December31, 2015, which excluded Ferrari’s Net Industrial Debt of
€963 million. The reduction in Net Industrial Debt during the year was primarily driven by:
(i) cash flow from industrial operating activities of €9,703 million which represents the majority of the consolidated
cash flow from operating activities of €9,751 million (refer to the section —Cash Flows above for an explanation of
the drivers in consolidated cash flows from operating activities);
(ii) net cash proceeds from the Ferrari IPO of €866 million;
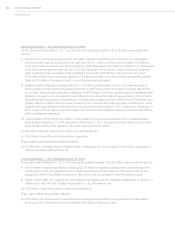
(iii) the payment to non-controlling interests for €280 million in connection with the Ferrari IPO and in preparation
for the spin-off of the remaining common shares of Ferrari N.V. owned by FCA (refer to the section —Principal
Activities within our Consolidated Financial Statements included elsewhere in this report);
(iv) positive translation exchange differences of €734 million, primarily reflecting the effect of the devaluation of
Brazilian Real when converting the Brazilian companies’ net industrial debt to Euro;
These items were partially offset by:
(v) investments in industrial activities of €8,816 million representing investments in property, plant and equipment and
intangible assets, acquisition and capital increases in joint ventures, associates and unconsolidated subsidiaries for
€268 million and cash used in industrial investing activities of discontinued operations of €372 million.
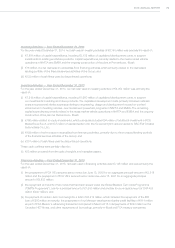
2014
In 2014, Net Industrial Debt increased by €640million, from €7,014million at December31, 2013 to €7,654million at
December31, 2014, which included Ferrari Net Industrial Debt. The movements in Net Industrial Debt were primarily
driven by:
(i) payments for the acquisition of the remaining 41.5 percent interest in FCA US previously not owned, inclusive of
the previously exercised options on approximately 10 percent of FCA US’s membership interest, of €2,691 million
(U.S.$3,650 million);
(ii) investments in industrial activities of €8,119 million representing investments in property, plant and equipment and
intangible assets (including Ferrari);
The increases noted above were partially offset by the reductions in Net Industrial Debt primarily driven by:
(iii) the issuance of the mandatory convertible securities due 2016 of €1,910 million (net proceeds of €2,245 million
net of the liability component of €335 million) and the net proceeds from the offering of 100 million common shares
of €849 million, net of the exercise of cash exit rights in connection with the Merger for a net aggregate cash
disbursement of €417 million; and
(iv) cash flow from industrial operating activities of €8,017 million which represented the consolidated cash flow
from operating activities of €8,169million, net of the cash flows from operating activities attributable to financial
services. For an explanation of the drivers in consolidated cash flows from operating activities, refer to the section
—Cash Flows above.