Chrysler 2015 Annual Report Download - page 74
Download and view the complete annual report
Please find page 74 of the 2015 Chrysler annual report below. You can navigate through the pages in the report by either clicking on the pages listed below, or by using the keyword search tool below to find specific information within the annual report.-
 1
1 -
2
-
3
-
4
-
5
-
6
-
7
-
8
-
9
-
10
-
11
-
12
-
13
-
14
-
15
-
16
-
17
-
18
-
19
-
20
-
21
-
22
-
23
-
24
-
25
-
26
-
27
-
28
-
29
-
30
-
31
-
32
-
33
-
34
-
35
-
36
-
37
-
38
-
39
-
40
-
41
-
42
-
43
-
44
-
45
-
46
-
47
-
48
-
49
-
50
-
51
-
52
-
53
-
54
-
55
-
56
-
57
-
58
-
59
-
60
-
61
-
62
-
63
-
 64
64 -
 65
65 -
 66
66 -
 67
67 -
 68
68 -
 69
69 -
 70
70 -
 71
71 -
 72
72 -
 73
73 -
 74
74 -
 75
75 -
 76
76 -
 77
77 -
 78
78 -
 79
79 -
 80
80 -
 81
81 -
 82
82 -
 83
83 -
 84
84 -
85
-
86
-
87
-
88
-
89
-
90
-
91
-
92
-
93
-
94
-
95
-
96
-
97
-
98
-
99
-
100
-
101
-
102
-
103
-
104
-
105
-
106
-
107
-
108
-
109
-
110
-
111
-
112
-
113
-
114
-
115
-
116
-
117
-
118
-
119
-
120
-
121
-
122
-
123
-
124
-
125
-
126
-
127
-
128
-
129
-
130
-
131
-
132
-
133
-
134
-
135
-
136
-
137
-
138
-
139
-
140
-
141
-
142
-
143
-
144
-
145
-
146
-
147
-
148
-
149
-
150
-
151
-
152
-
153
-
154
-
155
-
156
-
157
-
158
-
159
-
160
-
161
-
162
-
163
-
164
-
165
-
166
-
167
-
168
-
169
-
170
-
171
-
172
-
173
-
174
-
175
-
176
-
177
-
178
-
179
-
180
-
181
-
182
-
183
-
184
-
185
-
186
-
187
-
188
-
189
-
190
-
191
-
192
-
193
-
194
-
195
-
196
-
197
-
198
-
199
-
200
-
201
-
202
-
203
-
204
-
205
-
206
-
207
-
208
-
209
-
210
-
211
-
212
-
213
-
214
-
215
-
216
-
217
-
218
-
219
-
220
-
221
-
222
-
223
-
224
-
225
-
226
-
227
-
228
-
229
-
230
-
231
-
232
-
233
-
234
-
235
-
236
-
237
-
238
-
239
-
240
-
241
-
242
-
243
-
244
-
245
-
246
-
247
-
248
-
249
-
250
-
251
-
252
-
253
-
254
-
255
-
256
-
257
-
258
-
259
-
260
-
261
-
262
-
263
-
264
-
265
-
266
-
267
-
268
-
269
-
270
-
271
-
272
-
273
-
274
-
275
-
276
-
277
-
278
-
279
-
280
-
281
-
282
-
283
-
284
-
285
-
286
-
287
-
288
 |
 |

74 2015 | ANNUAL REPORT
Operating Results
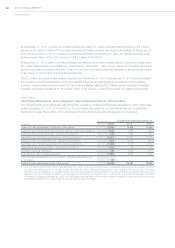
Net Debt
The following table details our Net debt at December31, 2015 and 2014 and provides a reconciliation of this non-GAAP
measure to Debt, the most directly comparable measure included in our Consolidated Statement of Financial Position.
Due to different sources of cash flows used for the repayment of the financial debt between industrial activities and
financial services (by cash from operations for industrial activities and by collection of financial receivables for financial
services) and the different business structure and leverage implications, we provide a separate analysis of Net Debt
between industrial activities and financial services.
The division between industrial activities and financial services represents a sub-consolidation based on the core
business activities (industrial or financial services) of each Group company. The sub-consolidation for industrial
activities also includes companies that perform centralized treasury activities, such as raising funding in the market
and financing Group companies, but do not however, provide financing to third parties. Financial services includes
companies that provide retail and dealer financing, leasing and rental services in support of the mass-market vehicle
brands in certain geographical segments and for the Maserati global luxury brand.
All FCA US activities are included under industrial activities. Since FCA US’s cash management activities are managed
separately from the rest of the Group, we also provide the analysis of Net Industrial Debt split between FCA excluding
FCA US and FCA US.
December 31, 2015(1) December 31, 2014
Industrial Activities
Financial
Services
Consoli-
dated Industrial Activities
Financial
Services
Consoli-
dated
(€ million) Total
FCA ex
FCA US FCA US Total
FCA ex
FCA US FCA US
Third Parties Debt (Principal) (26,555) (20,916) (5,639) (1,105) (27,660) (31,381) (21,011) (10,370) (1,980) (33,361)
Capital Market(2) (13,382) (13,382) — (264) (13,646) (17,378) (12,473) (4,905) (351) (17,729)
Bank Debt (11,602) (6,707) (4,895) (653) (12,255) (11,904) (7,484) (4,420) (1,216) (13,120)
Other Debt(3) (1,571) (827) (744) (188) (1,759) (2,099) (1,054) (1,045) (413) (2,512)
Accrued Interest and Other
Adjustments(4) (127) (145) 18 1 (126) (362) (200) (162) (1) (363)
Debt with third Parties (26,682) (21,061) (5,621) (1,104) (27,786) (31,743) (21,211) (10,532) (1,981) (33,724)
Intercompany Financial
Receivables/Payables (net)(5) 529 579 (50) (568) (39) 1,453 1,515 (62) (1,453) —
Current financial receivables
from jointly-controlled financial
services companies(6) 16 16 — — 16 58 58 — — 58
Debt, net of intercompany and
current financial receivables
from jointly-controlled financial
services companies (26,137) (20,466) (5,671) (1,672) (27,809) (30,232) (19,638) (10,594) (3,434) (33,666)
Other financial assets/
(liabilities) (net)(7) 103 (32) 135 14 117 (229) (251) 22 (4) (233)
Current securities 457 457 — 25 482 180 180 — 30 210
Cash and cash equivalents 20,528 10,142 10,386 134 20,662 22,627 10,653 11,974 213 22,840
Net (Debt)/Cash (5,049) (9,899) 4,850 (1,499) (6,548) (7,654) (9,056) 1,402 (3,195) (10,849)
(1) The assets and liabilities of the Ferrari segment have been classified as Assets held for distribution and Liabilities held for distribution within the
Consolidated Statement of Financial Position at December 31, 2015 and are not included in the figures presented. The assets and liabilities of
the Ferrari segment are included within the balances presented at December 31, 2014.
(2) Includes notes (€13,078 million at December31, 2015 and €16,980 million at December31, 2014), the financial liability component of the
mandatory convertible securities (€209 million at December31, 2015 and €373million at December31, 2014) and other securities (€359 million
at December31, 2015 and €376million at December31, 2014) issued in financial markets, mainly from LATAM financial services companies.
(3) Includes Canadian HCT notes (€354 million December31, 2015 and €620 million at December31, 2014), asset-backed financing, i.e. sales of
receivables for which de-recognition is not allowed under EU-IFRS (€206 million December31, 2015 and €469 million at December31, 2014)
and arrangements accounted for as a lease under IFRIC 4 - Determining whether an arrangement contains a lease, and other financial payables.
(4) Includes adjustments for fair value accounting on debt (€43 million at December31, 2015 and €67million at December31, 2014) and
(accrued)/deferred interest and other amortizing cost adjustments (€83 million at December31, 2015 and €296million at December31, 2014).
(5) Net amount between Industrial Activities financial receivables due from Financial Services (€664 million at December31, 2015 and €1,595
million at December31, 2014) and Industrial Activities financial payables due to Financial Services (€96 million at December31, 2015 and €142
million at December31, 2014). It also includes financial receivables due from discontinued operations (€98 million at December31, 2015) and
financial payables due to discontinued operations (€137 million at December31, 2015).
(6) Financial receivables due from FCA Bank.
(7) Fair value of derivative financial instruments (net positive €77 million at December31, 2015 and net negative €271 million at December31,
2014) and collateral deposits (€40 million at December31, 2015 and €38 millionat December31, 2014).