Chrysler 2015 Annual Report Download - page 46
Download and view the complete annual report
Please find page 46 of the 2015 Chrysler annual report below. You can navigate through the pages in the report by either clicking on the pages listed below, or by using the keyword search tool below to find specific information within the annual report.-
 1
1 -
2
-
3
-
4
-
5
-
6
-
7
-
8
-
9
-
10
-
11
-
12
-
13
-
14
-
15
-
16
-
17
-
18
-
19
-
20
-
21
-
22
-
23
-
24
-
25
-
26
-
27
-
28
-
29
-
30
-
31
-
32
-
33
-
34
-
35
-
 36
36 -
 37
37 -
 38
38 -
 39
39 -
 40
40 -
 41
41 -
 42
42 -
 43
43 -
 44
44 -
 45
45 -
 46
46 -
 47
47 -
 48
48 -
 49
49 -
 50
50 -
 51
51 -
 52
52 -
 53
53 -
 54
54 -
 55
55 -
 56
56 -
57
-
58
-
59
-
60
-
61
-
62
-
63
-
64
-
65
-
66
-
67
-
68
-
69
-
70
-
71
-
72
-
73
-
74
-
75
-
76
-
77
-
78
-
79
-
80
-
81
-
82
-
83
-
84
-
85
-
86
-
87
-
88
-
89
-
90
-
91
-
92
-
93
-
94
-
95
-
96
-
97
-
98
-
99
-
100
-
101
-
102
-
103
-
104
-
105
-
106
-
107
-
108
-
109
-
110
-
111
-
112
-
113
-
114
-
115
-
116
-
117
-
118
-
119
-
120
-
121
-
122
-
123
-
124
-
125
-
126
-
127
-
128
-
129
-
130
-
131
-
132
-
133
-
134
-
135
-
136
-
137
-
138
-
139
-
140
-
141
-
142
-
143
-
144
-
145
-
146
-
147
-
148
-
149
-
150
-
151
-
152
-
153
-
154
-
155
-
156
-
157
-
158
-
159
-
160
-
161
-
162
-
163
-
164
-
165
-
166
-
167
-
168
-
169
-
170
-
171
-
172
-
173
-
174
-
175
-
176
-
177
-
178
-
179
-
180
-
181
-
182
-
183
-
184
-
185
-
186
-
187
-
188
-
189
-
190
-
191
-
192
-
193
-
194
-
195
-
196
-
197
-
198
-
199
-
200
-
201
-
202
-
203
-
204
-
205
-
206
-
207
-
208
-
209
-
210
-
211
-
212
-
213
-
214
-
215
-
216
-
217
-
218
-
219
-
220
-
221
-
222
-
223
-
224
-
225
-
226
-
227
-
228
-
229
-
230
-
231
-
232
-
233
-
234
-
235
-
236
-
237
-
238
-
239
-
240
-
241
-
242
-
243
-
244
-
245
-
246
-
247
-
248
-
249
-
250
-
251
-
252
-
253
-
254
-
255
-
256
-
257
-
258
-
259
-
260
-
261
-
262
-
263
-
264
-
265
-
266
-
267
-
268
-
269
-
270
-
271
-
272
-
273
-
274
-
275
-
276
-
277
-
278
-
279
-
280
-
281
-
282
-
283
-
284
-
285
-
286
-
287
-
288
 |
 |

46 2015 | ANNUAL REPORT
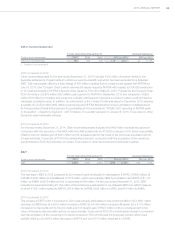
Overview of Our Business
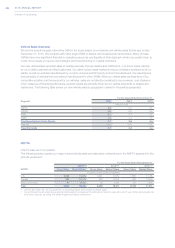
For the Years Ended December 31,
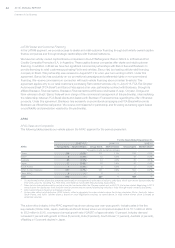
EMEA LightCommercial
Vehicles
2015(1),(2),(3) 2014(1),(2),(3) 2013(1),(2),(3)
GroupSales MarketShare GroupSales MarketShare GroupSales MarketShare
Thousands of units (except percentages)
Europe* 217 11.3% 197 11.5% 182 11.6%
Other EMEA** 77 — 68 — 68 —
Total 294 — 265 — 250 —
* 28 members of the European Union and members of the European Free Trade Association.
** Market share not included in Other EMEA because our presence is less than one percent.
(1) Certain fleet sales accounted for as operating leases are included in vehicle sales.
(2) Our estimated market share data is presented based on the national Registration Offices databases on products categorized under light
commercial vehicles.
(3) Sale data includes vehicle sales by our joint venture in Turkey.
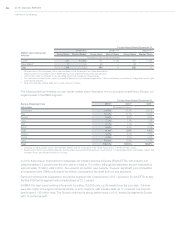
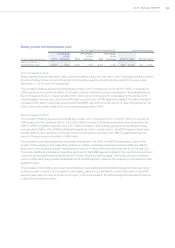
The following table summarizes our new vehicle market share information and our principal competitors in Europe, our
largest market in the EMEA segment:
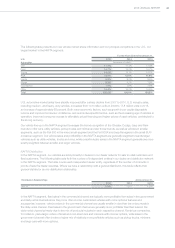
For the Years Ended December 31,
Europe-Passenger Cars 2015(*) 2014(*) 2013(*)
Automaker Percentage of industry
Volkswagen 24.8% 25.5% 25.1%
PSA 10.4% 10.7% 10.9%
Renault 9.6% 9.5% 8.9%
Ford 7.2% 7.3% 7.3%
GM 6.7% 7.1% 7.9%
BMW 6.6% 6.4% 6.4%
FCA(1) 6.1% 5.9% 6.0%
Daimler 5.9% 5.4% 5.5%
Toyota 4.3% 4.3% 4.4%
Other 18.4% 17.9% 17.6%
Total 100.0% 100.0% 100.0%
* Including all 28 European Union (EU) Member States and the 4 European Free Trade Association, or EFTA member states.
(1) Market share data is presented based on the European Automobile Manufacturers Association, or ACEA Registration Databases, which also
includes Ferrari and Maserati within our Group.
In 2015, there was an improvement in passenger car industry volumes in Europe (EU28+EFTA), with industry unit
sales increasing 9.2 percent over the prior year to a total of 14.2 million, although still well below the pre-crisis level of
approximately 16 million units in 2007. As a result of production over-capacity, however, significant price competition
among automotive OEMs continues to be a factor, particularly in the small and mid-size segments.
Fiat brand continued its leadership in the minicar segment with a market share of 27.7 percent in EU 28+EFTA. In Italy,
the Fiat 500X led its segment with a market share of 18.1 percent.
In EMEA the Jeep brand continued its growth, by selling 119,000 units, up 56 percent over the prior year. Volumes
were also higher in the light commercial vehicle, or LCV, segment, with industry sales up 11.4 percent over the prior
year to about 1.92 million units. The Ducato continued its strong performance in 2015, leading its segment in Europe
with 13 percent growth.