Chrysler 2015 Annual Report Download - page 50
Download and view the complete annual report
Please find page 50 of the 2015 Chrysler annual report below. You can navigate through the pages in the report by either clicking on the pages listed below, or by using the keyword search tool below to find specific information within the annual report.-
 1
1 -
2
-
3
-
4
-
5
-
6
-
7
-
8
-
9
-
10
-
11
-
12
-
13
-
14
-
15
-
16
-
17
-
18
-
19
-
20
-
21
-
22
-
23
-
24
-
25
-
26
-
27
-
28
-
29
-
30
-
31
-
32
-
33
-
34
-
35
-
36
-
37
-
38
-
39
-
 40
40 -
 41
41 -
 42
42 -
 43
43 -
 44
44 -
 45
45 -
 46
46 -
 47
47 -
 48
48 -
 49
49 -
 50
50 -
 51
51 -
 52
52 -
 53
53 -
 54
54 -
 55
55 -
 56
56 -
 57
57 -
 58
58 -
 59
59 -
 60
60 -
61
-
62
-
63
-
64
-
65
-
66
-
67
-
68
-
69
-
70
-
71
-
72
-
73
-
74
-
75
-
76
-
77
-
78
-
79
-
80
-
81
-
82
-
83
-
84
-
85
-
86
-
87
-
88
-
89
-
90
-
91
-
92
-
93
-
94
-
95
-
96
-
97
-
98
-
99
-
100
-
101
-
102
-
103
-
104
-
105
-
106
-
107
-
108
-
109
-
110
-
111
-
112
-
113
-
114
-
115
-
116
-
117
-
118
-
119
-
120
-
121
-
122
-
123
-
124
-
125
-
126
-
127
-
128
-
129
-
130
-
131
-
132
-
133
-
134
-
135
-
136
-
137
-
138
-
139
-
140
-
141
-
142
-
143
-
144
-
145
-
146
-
147
-
148
-
149
-
150
-
151
-
152
-
153
-
154
-
155
-
156
-
157
-
158
-
159
-
160
-
161
-
162
-
163
-
164
-
165
-
166
-
167
-
168
-
169
-
170
-
171
-
172
-
173
-
174
-
175
-
176
-
177
-
178
-
179
-
180
-
181
-
182
-
183
-
184
-
185
-
186
-
187
-
188
-
189
-
190
-
191
-
192
-
193
-
194
-
195
-
196
-
197
-
198
-
199
-
200
-
201
-
202
-
203
-
204
-
205
-
206
-
207
-
208
-
209
-
210
-
211
-
212
-
213
-
214
-
215
-
216
-
217
-
218
-
219
-
220
-
221
-
222
-
223
-
224
-
225
-
226
-
227
-
228
-
229
-
230
-
231
-
232
-
233
-
234
-
235
-
236
-
237
-
238
-
239
-
240
-
241
-
242
-
243
-
244
-
245
-
246
-
247
-
248
-
249
-
250
-
251
-
252
-
253
-
254
-
255
-
256
-
257
-
258
-
259
-
260
-
261
-
262
-
263
-
264
-
265
-
266
-
267
-
268
-
269
-
270
-
271
-
272
-
273
-
274
-
275
-
276
-
277
-
278
-
279
-
280
-
281
-
282
-
283
-
284
-
285
-
286
-
287
-
288
 |
 |

50 2015 | ANNUAL REPORT
Operating Results
Operating Results
Non-GAAP Financial Measures
We monitor our operations through the use of several non-generally accepted accounting procedures, or non-GAAP,
financial measures: Net Debt, Net Industrial Debt, Adjusted EBIT and certain information provided on a constant
currency basis. We believe that these non-GAAP financial measures provide useful and relevant information regarding
our operating results and enhance the overall ability to assess our financial performance and financial position. They
provide us with comparable measures which facilitate management’s ability to identify operational trends, as well as
make decisions regarding future spending, resource allocations and other operational decisions. These and similar
measures are widely used in the industry in which we operate.
These financial measures may not be comparable to other similarly titled measures of other companies and are not
intended to be substitutes for measures of financial performance and financial position as prepared in accordance with
EU-IFRS.
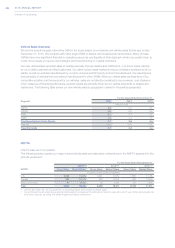
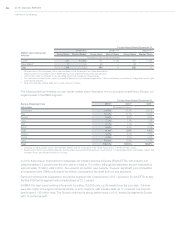
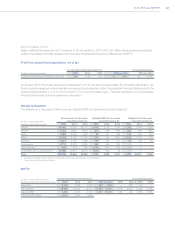
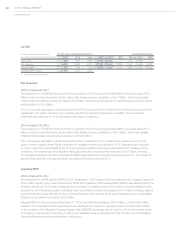
Net Debt
The following table details our Net Debt at December31, 2015 and 2014 and provides a reconciliation of this non-
GAAP measure to Debt, which is the most directly comparable measure included in our Consolidated Statement of
Financial Position.
Due to different sources of cash flows used for the repayment of the financial debt between industrial activities and
financial services (by cash from operations for industrial activities and by collection of financial receivables for financial
services) and the different business structure and leverage implications, we provide a separate analysis of Net Debt
between industrial activities and financial services.
The division between industrial activities and financial services represents a sub-consolidation based on the core
business activities (industrial or financial services) of each Group company. The sub-consolidation for industrial
activities also includes companies that perform centralized treasury activities, such as raising funding in the market
and financing Group companies, but do not, however, provide financing to third parties. Financial services includes
companies that provide retail and dealer finance, leasing and rental services in support of the mass-market vehicle
brands in certain geographical segments and for Maserati.
Net Industrial Debt (i.e., Net Debt of industrial activities) is management’s primary measure for analyzing our financial
leverage and capital structure and is one of the key targets used to measure our performance, however it should not
be considered as a substitute for cash flow or other methods of analyzing our results as reported under EU-IFRS.
December 31, 2015 December 31, 2014
Industrial
Activities
Financial
Services Consolidated
Industrial
Activities
Financial
Services Consolidated
(€ million)
Debt with third parties (26,682) (1,104) (27,786) (31,743) (1,981) (33,724)
Net intercompany financial receivables/
payables and current financial
receivables from jointly-controlled
financial services companies 545 (568) (23) 1,511 (1,453) 58
Other financial assets/(liabilities) (net) 103 14 117 (229) (4) (233)
Current securities 457 25 482 180 30 210
Cash and cash equivalents 20,528 134 20,662 22,627 213 22,840
Net Debt (5,049) (1,499) (6,548) (7,654) (3,195) (10,849)