Chrysler 2015 Annual Report Download - page 69
Download and view the complete annual report
Please find page 69 of the 2015 Chrysler annual report below. You can navigate through the pages in the report by either clicking on the pages listed below, or by using the keyword search tool below to find specific information within the annual report.-
 1
1 -
2
-
3
-
4
-
5
-
6
-
7
-
8
-
9
-
10
-
11
-
12
-
13
-
14
-
15
-
16
-
17
-
18
-
19
-
20
-
21
-
22
-
23
-
24
-
25
-
26
-
27
-
28
-
29
-
30
-
31
-
32
-
33
-
34
-
35
-
36
-
37
-
38
-
39
-
40
-
41
-
42
-
43
-
44
-
45
-
46
-
47
-
48
-
49
-
50
-
51
-
52
-
53
-
54
-
55
-
56
-
57
-
58
-
 59
59 -
 60
60 -
 61
61 -
 62
62 -
 63
63 -
 64
64 -
 65
65 -
 66
66 -
 67
67 -
 68
68 -
 69
69 -
 70
70 -
 71
71 -
 72
72 -
 73
73 -
 74
74 -
 75
75 -
 76
76 -
 77
77 -
 78
78 -
 79
79 -
80
-
81
-
82
-
83
-
84
-
85
-
86
-
87
-
88
-
89
-
90
-
91
-
92
-
93
-
94
-
95
-
96
-
97
-
98
-
99
-
100
-
101
-
102
-
103
-
104
-
105
-
106
-
107
-
108
-
109
-
110
-
111
-
112
-
113
-
114
-
115
-
116
-
117
-
118
-
119
-
120
-
121
-
122
-
123
-
124
-
125
-
126
-
127
-
128
-
129
-
130
-
131
-
132
-
133
-
134
-
135
-
136
-
137
-
138
-
139
-
140
-
141
-
142
-
143
-
144
-
145
-
146
-
147
-
148
-
149
-
150
-
151
-
152
-
153
-
154
-
155
-
156
-
157
-
158
-
159
-
160
-
161
-
162
-
163
-
164
-
165
-
166
-
167
-
168
-
169
-
170
-
171
-
172
-
173
-
174
-
175
-
176
-
177
-
178
-
179
-
180
-
181
-
182
-
183
-
184
-
185
-
186
-
187
-
188
-
189
-
190
-
191
-
192
-
193
-
194
-
195
-
196
-
197
-
198
-
199
-
200
-
201
-
202
-
203
-
204
-
205
-
206
-
207
-
208
-
209
-
210
-
211
-
212
-
213
-
214
-
215
-
216
-
217
-
218
-
219
-
220
-
221
-
222
-
223
-
224
-
225
-
226
-
227
-
228
-
229
-
230
-
231
-
232
-
233
-
234
-
235
-
236
-
237
-
238
-
239
-
240
-
241
-
242
-
243
-
244
-
245
-
246
-
247
-
248
-
249
-
250
-
251
-
252
-
253
-
254
-
255
-
256
-
257
-
258
-
259
-
260
-
261
-
262
-
263
-
264
-
265
-
266
-
267
-
268
-
269
-
270
-
271
-
272
-
273
-
274
-
275
-
276
-
277
-
278
-
279
-
280
-
281
-
282
-
283
-
284
-
285
-
286
-
287
-
288
 |
 |

2015 | ANNUAL REPORT 69
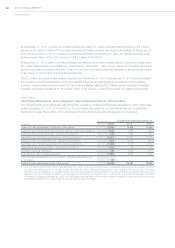
Operating Activities — Year Ended December 31, 2015
For the year ended December31, 2015, our net cash from operating activities of €9,751 million was primarily the
result of:
(i) net profit from continuing operations of €93 million adjusted to add back €5,414 million for depreciation and
amortization expense and other non-cash items of €812 million, which included (a) total €713 million non-cash
charges for asset impairments which mainly related to asset impairments in connection with the realignment of the
Group’s manufacturing capacity in NAFTA to better meet market demand and (b) €80 million charge recognized
as a result of the adoption of the SIMADI exchange rate to remeasure our Venezuelan subsidiary’s net monetary
assets in U.S.$ (reported, for the effect on cash and cash equivalents, within “Translation exchange differences”);
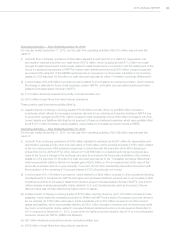
(ii) a net increase of €3,206 million in provisions mainly related to an increase in the warranty provision, which includes
the change in estimate for future recall campaign costs in NAFTA, and higher accrued sales incentives primarily
related to increased sales volumes in NAFTA;
(iii) €112 million dividends received from jointly-controlled entities; and
(iv) €527 million of cash flows from discontinued operations.
These positive cash flows were partially offset by:
(v) negative impact of change in working capital of €158 millionprimarily driven by (a)€958 million increase in
inventories, which reflects the increased consumer demand for our vehicles and inventory buildup in NAFTA due
to production changeovers (b)€191 million increase in trade receivables and (c)€580million increase in net other
current assets and liabilities reflecting the net payment of taxes and deferred expenses, which were partially offset
by (d)€1,571 million increase in trade payables, mainly related to increased production levels in EMEA.
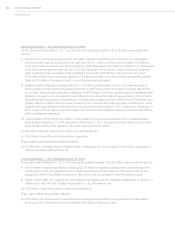
Operating Activities — Year Ended December 31, 2014
For the year ended December31, 2014, our net cash from operating activities of €8,169 million was primarily the
result of:
(i) net profit from continuing operations of €359 million adjusted to add back (a) €4,607 million for depreciation and
amortization expense and (b)other non-cash items of €348 million, which primarily included (i) €381 million related
to the non-cash portion of the expense recognized in connection with the execution of the MOU Agreement
entered into by the UAW and FCA US in January 2014 (ii) €98 million re-measurement charge recognized as a
result of the Group’s change in the exchange rate used to re-measure its Venezuelan subsidiary’s net monetary
assets in U.S.$ (reported, for the effect on cash and cash equivalents, in the “Translation exchange differences”)
which were partially offset by (iii) the non-taxable gain of €223 million on the re-measurement at fair value of the
previously exercised options on approximately 10 percent of FCA US’s membership interests in connection with
the acquisition of the remaining 41.5 percent interest in FCA US previously not owned;
(ii) a net increase of €1,169 million in provisions, mainly related to a €959 million increase in Other provisions following
net adjustments to warranties for NAFTA and higher accrued sales incentives, primarily due to an increase in retail
incentives as well as an increase in dealer stock levels to support increased sales volumes in NAFTA, and a €210
million increase in employees benefits mainly related to U.S. and Canada pension plan as the impact of lower
discount rates was not fully offset by the higher return on assets;
(iii) positive impact of change in working capital of €779 million primarily driven by (a)€1,470 million increase in trade
payables, mainly related to increased production in EMEA and NAFTA as a result of increased consumer demand
for our vehicles, (b)€106 million decrease in trade receivables and (c)€24 million increase in net other current
assets and liabilities, which were partially offset by (d)€821 million increase in inventory (net of vehicles sold under
buy-back commitments), mainly related to increased finished vehicle and work in process levels at December31,
2014 compared to December31, 2013, in part driven by higher production levels in late 2014 to meet anticipated
consumer demand in NAFTA, EMEA and Maserati;
(iv) €87 million dividends received from jointly-controlled entities; and
(v) €823 million of cash flows from discontinued operations.