Chrysler 2015 Annual Report Download - page 171
Download and view the complete annual report
Please find page 171 of the 2015 Chrysler annual report below. You can navigate through the pages in the report by either clicking on the pages listed below, or by using the keyword search tool below to find specific information within the annual report.-
 1
1 -
2
-
3
-
4
-
5
-
6
-
7
-
8
-
9
-
10
-
11
-
12
-
13
-
14
-
15
-
16
-
17
-
18
-
19
-
20
-
21
-
22
-
23
-
24
-
25
-
26
-
27
-
28
-
29
-
30
-
31
-
32
-
33
-
34
-
35
-
36
-
37
-
38
-
39
-
40
-
41
-
42
-
43
-
44
-
45
-
46
-
47
-
48
-
49
-
50
-
51
-
52
-
53
-
54
-
55
-
56
-
57
-
58
-
59
-
60
-
61
-
62
-
63
-
64
-
65
-
66
-
67
-
68
-
69
-
70
-
71
-
72
-
73
-
74
-
75
-
76
-
77
-
78
-
79
-
80
-
81
-
82
-
83
-
84
-
85
-
86
-
87
-
88
-
89
-
90
-
91
-
92
-
93
-
94
-
95
-
96
-
97
-
98
-
99
-
100
-
101
-
102
-
103
-
104
-
105
-
106
-
107
-
108
-
109
-
110
-
111
-
112
-
113
-
114
-
115
-
116
-
117
-
118
-
119
-
120
-
121
-
122
-
123
-
124
-
125
-
126
-
127
-
128
-
129
-
130
-
131
-
132
-
133
-
134
-
135
-
136
-
137
-
138
-
139
-
140
-
141
-
142
-
143
-
144
-
145
-
146
-
147
-
148
-
149
-
150
-
151
-
152
-
153
-
154
-
155
-
156
-
157
-
158
-
159
-
160
-
 161
161 -
 162
162 -
 163
163 -
 164
164 -
 165
165 -
 166
166 -
 167
167 -
 168
168 -
 169
169 -
 170
170 -
 171
171 -
 172
172 -
 173
173 -
 174
174 -
 175
175 -
 176
176 -
 177
177 -
 178
178 -
 179
179 -
 180
180 -
 181
181 -
182
-
183
-
184
-
185
-
186
-
187
-
188
-
189
-
190
-
191
-
192
-
193
-
194
-
195
-
196
-
197
-
198
-
199
-
200
-
201
-
202
-
203
-
204
-
205
-
206
-
207
-
208
-
209
-
210
-
211
-
212
-
213
-
214
-
215
-
216
-
217
-
218
-
219
-
220
-
221
-
222
-
223
-
224
-
225
-
226
-
227
-
228
-
229
-
230
-
231
-
232
-
233
-
234
-
235
-
236
-
237
-
238
-
239
-
240
-
241
-
242
-
243
-
244
-
245
-
246
-
247
-
248
-
249
-
250
-
251
-
252
-
253
-
254
-
255
-
256
-
257
-
258
-
259
-
260
-
261
-
262
-
263
-
264
-
265
-
266
-
267
-
268
-
269
-
270
-
271
-
272
-
273
-
274
-
275
-
276
-
277
-
278
-
279
-
280
-
281
-
282
-
283
-
284
-
285
-
286
-
287
-
288
 |
 |

2015 | ANNUAL REPORT 171
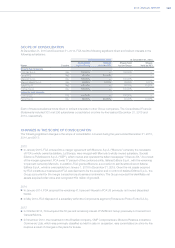
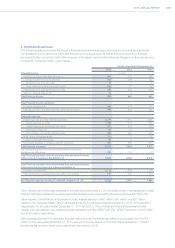
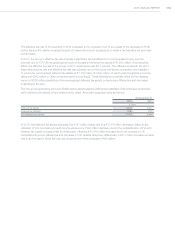
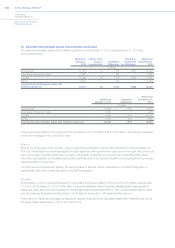
6. Net financial expenses
The following table summarizes the Group’s financial income and expenses, including the amounts reported in the
Consolidated Income Statement within Net financial income/(expenses), as well as interest income from financial
services activities, recognized within Net revenues, and interest cost and other financial charges from financial services
companies, recognized within Cost of sales.
For the Years Ended December 31,
2015 2014 2013
Financial income: (€ million)
Interest income and other financial income: 351 229 206
Interest income from banks deposits 157 169 152
Interest income from securities 10 7 8
Other interest income and financial income 184 53 46
Interest income of financial services activities 188 230 201
Gains on disposal of securities 14 3 4
Total Financial income 553 462 411
Total Financial income relating to:
Industrial companies (A) 365 232 210
Financial services companies (reported within Net revenues) 188 230 201
Financial expenses:
Interest expense and other financial expenses: 2,179 1,915 1,897
Interest expense on notes 1,196 1,204 959
Interest expense on borrowings from bank 527 426 367
Commission expenses 20 21 19
Other interest cost and financial expenses 436 264 552
Write-downs of financial assets 61 77 102
Losses on disposal of securities 28 6 3
Net interest expense on employee benefits provisions 350 330 371
Total Financial expenses 2,618 2,328 2,373
Net expenses/(income) from derivative financial instruments and
exchange rate differences 228 110 (1)
Total Financial expenses and net expenses from derivative financial
instruments and exchange rate differences 2,846 2,438 2,372
Total Financial expenses and net expenses from derivative financial
instruments and exchange rate differences relating to:
Industrial companies (B) 2,731 2,283 2,199
Financial services companies (reported within Cost of sales) 115 155 173
Net Financial expenses relating to industrial companies (A - B) 2,366 2,051 1,989
Other interest cost and financial expenses for the year ended December 31, 2015 included a loss on extinguishment of debt
totaling €168 million related to the prepayment of the secured senior notes of FCA US due in 2019 and 2021 (Note 23).
Other interest cost and financial expenses included interest expense of €41 million, €50 million, and €61 million
related to the Canadian Health Care Trust Notes (Note 23) for the years ended December 31, 2015, 2014 and 2013,
respectively. For the years ended December 31, 2014 and 2013, Other interest and financial expenses included
interest expense related to the outstanding financial liability with the VEBA Trust (the “VEBA Trust Note”) of €33 million
and €326 million, respectively.
Net expenses/(income) from derivative financial instruments and exchange rate differences included income of €31
million for the year ended December 31, 2013 arising from equity swaps on FCA and CNH Industrial N.V. (“CNHI”)
shares relating to certain stock option plans that had expired in 2013.