Chrysler 2015 Annual Report Download - page 232
Download and view the complete annual report
Please find page 232 of the 2015 Chrysler annual report below. You can navigate through the pages in the report by either clicking on the pages listed below, or by using the keyword search tool below to find specific information within the annual report.-
 1
1 -
2
-
3
-
4
-
5
-
6
-
7
-
8
-
9
-
10
-
11
-
12
-
13
-
14
-
15
-
16
-
17
-
18
-
19
-
20
-
21
-
22
-
23
-
24
-
25
-
26
-
27
-
28
-
29
-
30
-
31
-
32
-
33
-
34
-
35
-
36
-
37
-
38
-
39
-
40
-
41
-
42
-
43
-
44
-
45
-
46
-
47
-
48
-
49
-
50
-
51
-
52
-
53
-
54
-
55
-
56
-
57
-
58
-
59
-
60
-
61
-
62
-
63
-
64
-
65
-
66
-
67
-
68
-
69
-
70
-
71
-
72
-
73
-
74
-
75
-
76
-
77
-
78
-
79
-
80
-
81
-
82
-
83
-
84
-
85
-
86
-
87
-
88
-
89
-
90
-
91
-
92
-
93
-
94
-
95
-
96
-
97
-
98
-
99
-
100
-
101
-
102
-
103
-
104
-
105
-
106
-
107
-
108
-
109
-
110
-
111
-
112
-
113
-
114
-
115
-
116
-
117
-
118
-
119
-
120
-
121
-
122
-
123
-
124
-
125
-
126
-
127
-
128
-
129
-
130
-
131
-
132
-
133
-
134
-
135
-
136
-
137
-
138
-
139
-
140
-
141
-
142
-
143
-
144
-
145
-
146
-
147
-
148
-
149
-
150
-
151
-
152
-
153
-
154
-
155
-
156
-
157
-
158
-
159
-
160
-
161
-
162
-
163
-
164
-
165
-
166
-
167
-
168
-
169
-
170
-
171
-
172
-
173
-
174
-
175
-
176
-
177
-
178
-
179
-
180
-
181
-
182
-
183
-
184
-
185
-
186
-
187
-
188
-
189
-
190
-
191
-
192
-
193
-
194
-
195
-
196
-
197
-
198
-
199
-
200
-
201
-
202
-
203
-
204
-
205
-
206
-
207
-
208
-
209
-
210
-
211
-
212
-
213
-
214
-
215
-
216
-
217
-
218
-
219
-
220
-
221
-
 222
222 -
 223
223 -
 224
224 -
 225
225 -
 226
226 -
 227
227 -
 228
228 -
 229
229 -
 230
230 -
 231
231 -
 232
232 -
 233
233 -
 234
234 -
 235
235 -
 236
236 -
 237
237 -
 238
238 -
 239
239 -
 240
240 -
 241
241 -
 242
242 -
243
-
244
-
245
-
246
-
247
-
248
-
249
-
250
-
251
-
252
-
253
-
254
-
255
-
256
-
257
-
258
-
259
-
260
-
261
-
262
-
263
-
264
-
265
-
266
-
267
-
268
-
269
-
270
-
271
-
272
-
273
-
274
-
275
-
276
-
277
-
278
-
279
-
280
-
281
-
282
-
283
-
284
-
285
-
286
-
287
-
288
 |
 |

232 2015 | ANNUAL REPORT
Consolidated
Financial Statements
Notes to the Consolidated
Financial Statements
30. Venezuela Currency Regulations and Devaluation
On February 10, 2015, the Venezuelan government introduced a new market-based exchange system, the SIMADI
exchange rate, with certain specified limitations on its usage by individuals and legal entities. On February 12, 2015,
the SIMADI exchange rate began trading at 170.0 VEF to U.S.$ for individuals and entities in the private sector. In
February 2015, the Venezuelan government also announced that the Supplementary Foreign Currency Administration
System (“SICAD I”) and the additional auction-based foreign exchange system introduced by the Venezuelan
government in March 2014 (“SICAD II”) would be merged into a single exchange system (the “SICAD”) with a rate
starting at 12.0 VEF to U.S.$. As of March 31, 2015, the SICAD exchange rate was expected to be used to complete
the majority of FCA Venezuela’s transactions to exchange VEF for U.S.$ and as such, it was deemed the appropriate
rate to use to convert our VEF denominated monetary assets and liabilities to U.S.$ for the first quarter 2015.
Due to the continuing deterioration of the economic conditions in Venezuela, as of June 30, 2015, we determined
that it was unlikely that the majority of our future transactions to exchange VEF to U.S.$ would be at the SICAD
rate. Rather, we had determined that the SIMADI exchange rate was the most appropriate rate to use based on
the volume of VEF to U.S.$ exchange transactions that have occurred in Venezuela utilizing the SIMADI exchange
rate as compared to the SICAD. As a result of adopting the SIMADI exchange rate at June 30, 2015, we recorded
a remeasurement charge on our VEF denominated net monetary assets, including cash and cash equivalents in
Venezuela of €53 million using an exchange rate of 197.3 VEF per U.S.$. In addition to the remeasurement charge,
we recorded a €27 million charge for the write-down of inventory in Venezuela to the lower of cost or net realizable
value, as due to pricing controls, we are unable to increase the VEF sales price in Venezuela to compensate for the
devaluation. As of December 31, 2015, the SIMADI exchange rate of 199 VEF per U.S.$ did not result in the recording
of any additional material charges. The total charge of €80 million was recorded in Cost of Sales for the year ended
December 31, 2015.
During the year ended December 31, 2014, we recorded a remeasurement charge of €98 million in Cost of Sales
resulting from our initial adoption of the SICAD I exchange rate to remeasure our VEF denominated net monetary assets.
During the year ended December 31, 2013, we recorded €43 million in Cost of Sales for the devaluation of the VEF
exchange rate relative to the U.S.$ and the remeasurement on the Group’s VEF denominated net monetary assets.
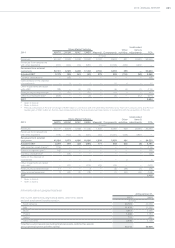
31. Qualitative and quantitative information on financial risks
The Group is exposed to the following financial risks connected with its operations:
credit risk, principally arising from its normal commercial relations with final customers and dealers, and its financing
activities;
liquidity risk, with particular reference to the availability of funds and access to the credit market and to financial
instruments in general;
financial market risk (principally relating to exchange rates, interest rates and commodity prices), since the Group
operates at an international level in different currencies and uses financial instruments which generate interest. The
Group is also exposed to the risk of changes in the price of certain commodities and of certain listed shares.
These risks could significantly affect the Group’s financial position and results and for this reason, the Group
systematically identifies and monitors these risks in order to detect potential negative effects in advance and take the
necessary action to mitigate them, primarily through its operating and financing activities and if required, through the
use of derivative financial instruments in accordance with established risk management policies.
Financial instruments held by the funds that manage pension plan assets are not included in this analysis (see Note 21).
The following section provides qualitative and quantitative disclosures on the effect that these risks may have upon the
Group. The quantitative data reported in the following does not have any predictive value, in particular the sensitivity
analysis on finance market risks does not reflect the complexity of the market or the reaction which may result from
any changes that are assumed to take place.