Chrysler 2015 Annual Report Download - page 57
Download and view the complete annual report
Please find page 57 of the 2015 Chrysler annual report below. You can navigate through the pages in the report by either clicking on the pages listed below, or by using the keyword search tool below to find specific information within the annual report.-
 1
1 -
2
-
3
-
4
-
5
-
6
-
7
-
8
-
9
-
10
-
11
-
12
-
13
-
14
-
15
-
16
-
17
-
18
-
19
-
20
-
21
-
22
-
23
-
24
-
25
-
26
-
27
-
28
-
29
-
30
-
31
-
32
-
33
-
34
-
35
-
36
-
37
-
38
-
39
-
40
-
41
-
42
-
43
-
44
-
45
-
46
-
 47
47 -
 48
48 -
 49
49 -
 50
50 -
 51
51 -
 52
52 -
 53
53 -
 54
54 -
 55
55 -
 56
56 -
 57
57 -
 58
58 -
 59
59 -
 60
60 -
 61
61 -
 62
62 -
 63
63 -
 64
64 -
 65
65 -
 66
66 -
 67
67 -
68
-
69
-
70
-
71
-
72
-
73
-
74
-
75
-
76
-
77
-
78
-
79
-
80
-
81
-
82
-
83
-
84
-
85
-
86
-
87
-
88
-
89
-
90
-
91
-
92
-
93
-
94
-
95
-
96
-
97
-
98
-
99
-
100
-
101
-
102
-
103
-
104
-
105
-
106
-
107
-
108
-
109
-
110
-
111
-
112
-
113
-
114
-
115
-
116
-
117
-
118
-
119
-
120
-
121
-
122
-
123
-
124
-
125
-
126
-
127
-
128
-
129
-
130
-
131
-
132
-
133
-
134
-
135
-
136
-
137
-
138
-
139
-
140
-
141
-
142
-
143
-
144
-
145
-
146
-
147
-
148
-
149
-
150
-
151
-
152
-
153
-
154
-
155
-
156
-
157
-
158
-
159
-
160
-
161
-
162
-
163
-
164
-
165
-
166
-
167
-
168
-
169
-
170
-
171
-
172
-
173
-
174
-
175
-
176
-
177
-
178
-
179
-
180
-
181
-
182
-
183
-
184
-
185
-
186
-
187
-
188
-
189
-
190
-
191
-
192
-
193
-
194
-
195
-
196
-
197
-
198
-
199
-
200
-
201
-
202
-
203
-
204
-
205
-
206
-
207
-
208
-
209
-
210
-
211
-
212
-
213
-
214
-
215
-
216
-
217
-
218
-
219
-
220
-
221
-
222
-
223
-
224
-
225
-
226
-
227
-
228
-
229
-
230
-
231
-
232
-
233
-
234
-
235
-
236
-
237
-
238
-
239
-
240
-
241
-
242
-
243
-
244
-
245
-
246
-
247
-
248
-
249
-
250
-
251
-
252
-
253
-
254
-
255
-
256
-
257
-
258
-
259
-
260
-
261
-
262
-
263
-
264
-
265
-
266
-
267
-
268
-
269
-
270
-
271
-
272
-
273
-
274
-
275
-
276
-
277
-
278
-
279
-
280
-
281
-
282
-
283
-
284
-
285
-
286
-
287
-
288
 |
 |

2015 | ANNUAL REPORT 57
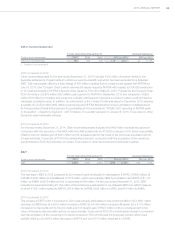
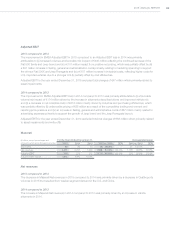
2014 compared to 2013
Higher deferred tax expense in 2014 was due to the recognition in 2013 of €1,500 million of previously unrecognized
deferred tax assets, primarily related to tax loss carry forwards and temporary differences in NAFTA.
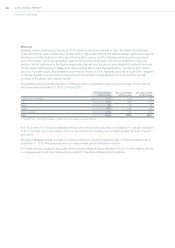
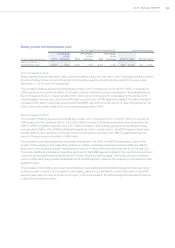
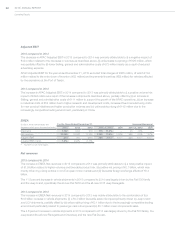
Profit from discontinued operations, net of tax
For the Years Ended December 31, Increase/(decrease)
(€ million, except percentages) 2015 2014 2013 2015 vs. 2014 2014 vs. 2013
Profit from discontinued operations, net of tax 284 273 243 11 4.0% 30 12.3%
As the spin-off of Ferrari was approved on December 3, 2015 and since it was available for immediate distribution, our
Ferrari operating segment was presented as a discontinued operation in the Consolidated Financial Statements for the
years ended December 31, 2015, 2014 and 2013. For more information, see —Principal Activities in our Consolidated
Financial Statements included elsewhere in this report.
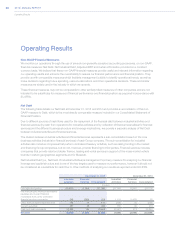
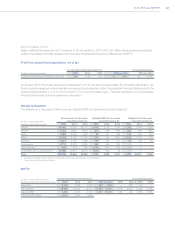
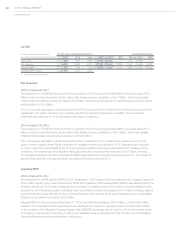
Results by Segment
The following is a discussion of Net revenues, Adjusted EBIT and shipments for each segment.
(€million,except shipments
whichare in thousands of units)
Net revenues for the years
ended December31,
Adjusted EBITfor the years
endedDecember31,
Shipmentsfor the years
endedDecember31,
2015 2014 2013 2015 2014 2013 2015 2014 2013
NAFTA 69,992 52,452 45,777 4,450 2,179 2,219 2,726 2,493 2,238
LATAM 6,431 8,629 9,973 (87) 289 619 553 827 950
APAC 4,885 6,259 4,668 52 541 338 149 220 163
EMEA 20,350 18,020 17,335 213 (41) (291) 1,142 1,024 979
Maserati 2,411 2,767 1,659 105 275 171 32 36 15
Components 9,770 8,619 8,080 395 285 208 —— —
Other activities 844 831 929 (150) (116) (80) —— —
Unallocated items & adjustments(1) (4,088) (3,937) (3,891) (184) (50) (3) —— —
Total 110,595 93,640 84,530 4,794 3,362 3,181 4,602 4,601(2) 4,345
(1) Primarily includes intercompany transactions which are eliminated in consolidation
(2) Total do not add due to rounding
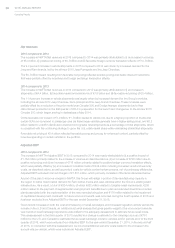
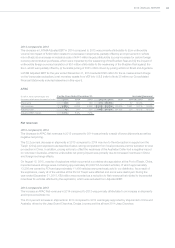
NAFTA
(€ million, except percentages and
shipments which are in thousands of units)
For the Years Ended December 31, Increase/(decrease)
2015 2014 2013 2015 vs. 2014 CER 2014 vs. 2013 CER
Shipments 2,726 2,493 2,238 233 9.3% — 255 11.4% —
Net revenues 69,992 52,452 45,777 17,540 33.4% 13.1% 6,675 14.6% 14.6%
Adjusted EBIT 4,450 2,179 2,219 2,271 104.2% 71.3% (40) (1.8)% (1.8)%
Adjusted EBIT margin 6.4% 4.2% 4.8%