Chrysler 2015 Annual Report Download - page 56
Download and view the complete annual report
Please find page 56 of the 2015 Chrysler annual report below. You can navigate through the pages in the report by either clicking on the pages listed below, or by using the keyword search tool below to find specific information within the annual report.-
 1
1 -
2
-
3
-
4
-
5
-
6
-
7
-
8
-
9
-
10
-
11
-
12
-
13
-
14
-
15
-
16
-
17
-
18
-
19
-
20
-
21
-
22
-
23
-
24
-
25
-
26
-
27
-
28
-
29
-
30
-
31
-
32
-
33
-
34
-
35
-
36
-
37
-
38
-
39
-
40
-
41
-
42
-
43
-
44
-
45
-
 46
46 -
 47
47 -
 48
48 -
 49
49 -
 50
50 -
 51
51 -
 52
52 -
 53
53 -
 54
54 -
 55
55 -
 56
56 -
 57
57 -
 58
58 -
 59
59 -
 60
60 -
 61
61 -
 62
62 -
 63
63 -
 64
64 -
 65
65 -
 66
66 -
67
-
68
-
69
-
70
-
71
-
72
-
73
-
74
-
75
-
76
-
77
-
78
-
79
-
80
-
81
-
82
-
83
-
84
-
85
-
86
-
87
-
88
-
89
-
90
-
91
-
92
-
93
-
94
-
95
-
96
-
97
-
98
-
99
-
100
-
101
-
102
-
103
-
104
-
105
-
106
-
107
-
108
-
109
-
110
-
111
-
112
-
113
-
114
-
115
-
116
-
117
-
118
-
119
-
120
-
121
-
122
-
123
-
124
-
125
-
126
-
127
-
128
-
129
-
130
-
131
-
132
-
133
-
134
-
135
-
136
-
137
-
138
-
139
-
140
-
141
-
142
-
143
-
144
-
145
-
146
-
147
-
148
-
149
-
150
-
151
-
152
-
153
-
154
-
155
-
156
-
157
-
158
-
159
-
160
-
161
-
162
-
163
-
164
-
165
-
166
-
167
-
168
-
169
-
170
-
171
-
172
-
173
-
174
-
175
-
176
-
177
-
178
-
179
-
180
-
181
-
182
-
183
-
184
-
185
-
186
-
187
-
188
-
189
-
190
-
191
-
192
-
193
-
194
-
195
-
196
-
197
-
198
-
199
-
200
-
201
-
202
-
203
-
204
-
205
-
206
-
207
-
208
-
209
-
210
-
211
-
212
-
213
-
214
-
215
-
216
-
217
-
218
-
219
-
220
-
221
-
222
-
223
-
224
-
225
-
226
-
227
-
228
-
229
-
230
-
231
-
232
-
233
-
234
-
235
-
236
-
237
-
238
-
239
-
240
-
241
-
242
-
243
-
244
-
245
-
246
-
247
-
248
-
249
-
250
-
251
-
252
-
253
-
254
-
255
-
256
-
257
-
258
-
259
-
260
-
261
-
262
-
263
-
264
-
265
-
266
-
267
-
268
-
269
-
270
-
271
-
272
-
273
-
274
-
275
-
276
-
277
-
278
-
279
-
280
-
281
-
282
-
283
-
284
-
285
-
286
-
287
-
288
 |
 |

56 2015 | ANNUAL REPORT
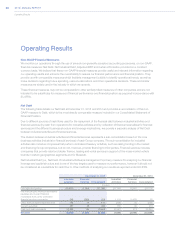
Operating Results
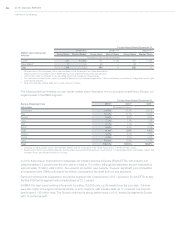
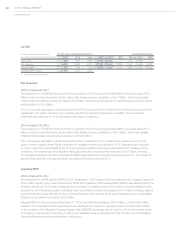
Adjusted EBIT
For the Years Ended December 31, Increase/(decrease)
(€ million, except percentages) 2015 2014 2013 2015 vs. 2014 2014 vs. 2013
Adjusted EBIT 4,794 3,362 3,181 1,432 42.6% 181 5.7%
For a detailed discussion of group Adjusted EBIT by segment for the years ended December31, 2015, 2014 and
2013, see —Results by Segment below. Refer to Note 29 within the Consolidated Financial Statements included
elsewhere in this report for a reconciliation of Adjusted EBIT to EBIT, which is the most directly comparable measure
included in the Consolidated Income Statement.
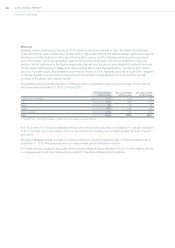
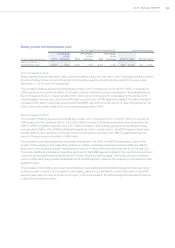
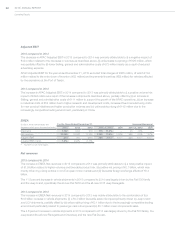
Net financial expenses
For the Years Ended December 31, Increase/(decrease)
(€ million, except percentages) 2015 2014 2013 2015 vs. 2014 2014 vs. 2013
Net financial expenses 2,366 2,051 1,989 315 15.4% 62 3.1%
2015 compared to 2014
The increase in Net financial expenses in 2015 compared to 2014 was primarily due to higher debt levels and interest
rates in Brazil, the net loss of €168 million recognized in connection with the prepayments of the FCA US secured
senior notes due in 2019 and 2021, which included the call premiums, net of the remaining unamortized debt
premiums, as well as unfavorable foreign currency translation. The increase was partially offset by interest cost savings
resulting from the refinancing and reduction in overall gross debt in 2015.
2014 compared to 2013
Excluding the gain on the Fiat stock option-related equity swaps of €31 million recognized in 2013, net financial
expenses were substantially unchanged as the benefits from the financing transactions completed in February 2014
by FCA US were offset by higher average debt levels (refer to Note 23 within the Consolidated Financial Statements
included elsewhere in this report for a more detailed description of FCA US’s financings).
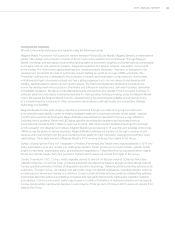
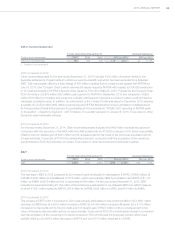
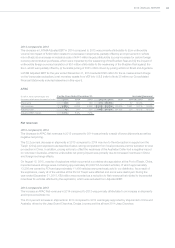
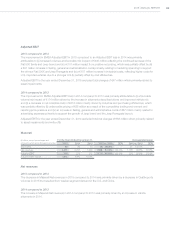
Tax expense/(income)
For the Years Ended December 31, Increase/(decrease)
(€ million, except percentages) 2015 2014 2013 2015 vs. 2014 2014 vs. 2013
Tax expense/(income) 166 424 (1,059) (258) (60.8)% 1,483 n.m.(1)
(1) Number is not meaningful.
2015 compared to 2014
The decrease in tax expense in 2015 compared to 2014 was primarily related to lower Profit before taxes and a higher
amount of non-taxable incentives. The decrease in tax expense was partially offset by a decrease in certain one-time
discrete items as Profit before taxes for the year ended December31, 2014 included the non-taxable gain related to
the fair value remeasurement of the previously exercised options in connection with the acquisition of the remaining
equity interest of FCA US previously not owned.
The effective tax rate increased from 46.4 percent in 2014 to 54.4 percent in 2015 as a result of the decrease in Profit
before tax and the relative increased impact of losses before tax in jurisdictions in which a tax benefit is not recorded
on tax losses.