Chrysler 2015 Annual Report Download - page 173
Download and view the complete annual report
Please find page 173 of the 2015 Chrysler annual report below. You can navigate through the pages in the report by either clicking on the pages listed below, or by using the keyword search tool below to find specific information within the annual report.-
 1
1 -
2
-
3
-
4
-
5
-
6
-
7
-
8
-
9
-
10
-
11
-
12
-
13
-
14
-
15
-
16
-
17
-
18
-
19
-
20
-
21
-
22
-
23
-
24
-
25
-
26
-
27
-
28
-
29
-
30
-
31
-
32
-
33
-
34
-
35
-
36
-
37
-
38
-
39
-
40
-
41
-
42
-
43
-
44
-
45
-
46
-
47
-
48
-
49
-
50
-
51
-
52
-
53
-
54
-
55
-
56
-
57
-
58
-
59
-
60
-
61
-
62
-
63
-
64
-
65
-
66
-
67
-
68
-
69
-
70
-
71
-
72
-
73
-
74
-
75
-
76
-
77
-
78
-
79
-
80
-
81
-
82
-
83
-
84
-
85
-
86
-
87
-
88
-
89
-
90
-
91
-
92
-
93
-
94
-
95
-
96
-
97
-
98
-
99
-
100
-
101
-
102
-
103
-
104
-
105
-
106
-
107
-
108
-
109
-
110
-
111
-
112
-
113
-
114
-
115
-
116
-
117
-
118
-
119
-
120
-
121
-
122
-
123
-
124
-
125
-
126
-
127
-
128
-
129
-
130
-
131
-
132
-
133
-
134
-
135
-
136
-
137
-
138
-
139
-
140
-
141
-
142
-
143
-
144
-
145
-
146
-
147
-
148
-
149
-
150
-
151
-
152
-
153
-
154
-
155
-
156
-
157
-
158
-
159
-
160
-
161
-
162
-
 163
163 -
 164
164 -
 165
165 -
 166
166 -
 167
167 -
 168
168 -
 169
169 -
 170
170 -
 171
171 -
 172
172 -
 173
173 -
 174
174 -
 175
175 -
 176
176 -
 177
177 -
 178
178 -
 179
179 -
 180
180 -
 181
181 -
 182
182 -
 183
183 -
184
-
185
-
186
-
187
-
188
-
189
-
190
-
191
-
192
-
193
-
194
-
195
-
196
-
197
-
198
-
199
-
200
-
201
-
202
-
203
-
204
-
205
-
206
-
207
-
208
-
209
-
210
-
211
-
212
-
213
-
214
-
215
-
216
-
217
-
218
-
219
-
220
-
221
-
222
-
223
-
224
-
225
-
226
-
227
-
228
-
229
-
230
-
231
-
232
-
233
-
234
-
235
-
236
-
237
-
238
-
239
-
240
-
241
-
242
-
243
-
244
-
245
-
246
-
247
-
248
-
249
-
250
-
251
-
252
-
253
-
254
-
255
-
256
-
257
-
258
-
259
-
260
-
261
-
262
-
263
-
264
-
265
-
266
-
267
-
268
-
269
-
270
-
271
-
272
-
273
-
274
-
275
-
276
-
277
-
278
-
279
-
280
-
281
-
282
-
283
-
284
-
285
-
286
-
287
-
288
 |
 |

2015 | ANNUAL REPORT 173
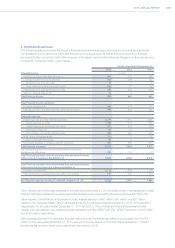
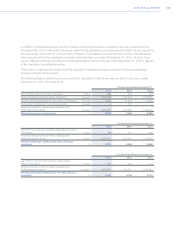
The effective tax rate of 46.4 percent in 2014 increased to 54.4 percent in 2015 as a result of the decrease in Profit
before tax and the relative increased impact of losses before tax in jurisdictions in which a tax benefit is not recorded
on tax losses.
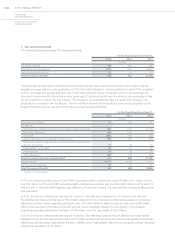
In 2013, the Group’s effective tax rate includes a significant tax benefit and is not comparable to prior periods
primarily due to FCA US recognizing previously unrecognized deferred tax assets of €1,500 million. Excluding this
effect, the effective tax rate of the Group in 2013 would have been 60.1 percent. The difference between the 2013
Italian statutory tax rate and effective tax rate was primarily due to the above-mentioned recognition and utilization
of previously unrecognized deferred tax assets of €1,742 million (€1,500 million. of which was recognized in income
taxes and €242 million in Other comprehensive income/(loss)). These benefits were partially offset by the negative
impact of €380 million arising from the unrecognized deferred tax assets on temporary differences and tax losses
originating in the year.
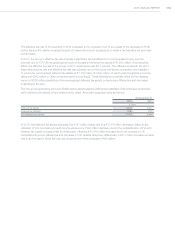
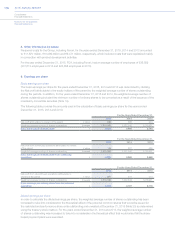
The Group recognizes the amount of Deferred tax assets less the Deferred tax liabilities of the individual companies
within Deferred tax assets, where these may be offset. Amounts recognized were as follows:
At December 31,
2015 2014
(€ million)
Deferred tax assets 3,343 3,547
Deferred tax liabilities (156) (233)
Net deferred tax assets 3,187 3,314
In 2015, Net deferred tax assets decreased by €127 million mainly due to a €1,374 million decrease related to the
utilization of U.S. tax loss and credit carryforwards and a €104 million decrease due to the reclassification of Ferrari’s
deferred tax assets to Assets held for distribution, offset by a €1,076 million increase due to an increase in U.S.
deductible temporary differences and decrease in U.S. taxable temporary differences, a €211 million increase primarily
due to an increase in Brazil tax loss carryforwards and other increases of €64 million.